. 2025 Mar 6;16(1):2233.
doi: 10.1038/s41467-025-57368-7.

Tracking HIV persistence across T cell lineages during early ART-treated HIV-1-infection using a reservoir-marking humanized mouse model

Affiliations

Tracking HIV persistence across T cell lineages during early ART-treated HIV-1-infection using a reservoir-marking humanized mouse model

Namita Satija et al. Nat Commun. .

Abstract

Human immunodeficiency virus (HIV) infection depletes CD4 T-cells, and long-term persistence of latent virus prevents full clearance of HIV even in the presence of effective antiretroviral therapy (ART), Here we present the HIV-1-induced lineage tracing (HILT) system, a model that irreversibly marks infected cells within a humanized mouse model, which detects rare latently infected cells. Immunodeficient mice transplanted with genetically modified hematopoietic stem cells develop a human immune system, in which CD4 T-cells contain a genetic switch that permanently labels cells infected by HIV-1 expressing cre-recombinase. Through single-cell RNA sequencing of HILT-marked cells during acute infection and post-ART treatment, we identify distinct CD4+ T-cell transcriptional lineages enriched in either active or latent infections. Comparative gene expression analysis highlights common pathways modulated in both states, including EIF2, Sirtuin, and protein ubiquitination. Critical regulators of these pathways, including JUN, BCL2, and MDM2, change to opposite directions in the two states, highlighting gene expression programs that may support HIV persistence across T-cell lineages and states.


Conflict of interest statement

Competing interests: The authors declare no competing interests.

Figures

Fig. 1
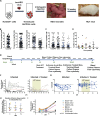
Fig. 1. HIV-1 induced lineage tracing (HILT) system enables the tracking of infected cells both in vitro and in vivo.
A Lentiviral vector pHR SIN CS(RG)W (Lenti-RG) carries a floxed dsRed gene followed by a GFP gene, which switches from red to green in the presence of Cre. B HIV-1 NL-CreI (RHPA), an HIV-1 clone that carries cre in place of nef, and nef expression is restored with an internal ribosome entry site (HIV- Cre). The virus carries an Env gene from a transmitted founder virus, RHPA. C Schematic representation of infection. Jurkat T cells were transduced with Lenti-RG and infected with HIV-Cre. D Flow cytometry plots of red to green switch in vitro in Jurkat cells after infection with NL Cre I and treated with AZT. E Bar plots represent log fold change of HIV Cre DNA in GFP+, dsRed + (GFP-), relative to double negative (DN) cells. The signals from two different primer-probe sets are illustrated in blue and black. Data represent mean +/- SD from n = 3 cells separate infections, Unpaired t test (F) Experimental timeline for infection of transduced HuPBL mice with HIV-Cre and HIV-GFP virus. (G) Plasma viremia of HIV-CreI monitored over time in infected Hu-PBL mice in comparison to a HIV-expressing HIV, NL-GI (n = 3 infected vs n = 3 uninfected), unpaired t test, p = 0.37 (ns). H Splenocytes from HIV-Cre infected HuPBL Lenti-RG mice were sorted at 21 dpi for GFP+, dsRed + (GFP-), and DN cells, and (I) Sorted cells from infected huPBL mice (M5 and M6) were flow sorted and pooled by phenotype, yielding 32,302 GFP+ cells, 877,686 dsRed+ cells, and 1.2 ×10^6 double negative (DN) cells to make DNA for quantitative PCR analysis. Q-PCR for HIV DNA shows log-fold change relative to the double negative population. Bar plots representing high enrichment of HIV-Cre DNA in the GFP+ switched cells in HuPBL mice.
Fig. 2
Fig. 2. Strategy for generating HILT mice.
A Newborn NSG mice are injected with Lenti-RG transduced cord blood-derived HuCD34+ hematopoietic stem cells and are engrafted with human immune cell lineages in 16 weeks. B Percentages of total peripheral blood cells in reconstituted NSG mice measuring huCD45, CD3, CD4, or CD8, respectively, at week 16 (n = 184 mice, data represented as mean +/− SD). C Frequency of dsRed+ cells in huCD45, CD3, CD4 and CD8 cells. (n = 184 mice, data represent mean +/− SD). D The percentage of engrafted CD4+ dsRed+ T cells throughout the lifetime of the mice (n = 14 mice, data represented as mean +/- SD), with each individual mouse represented as the same color filled, with a different symbol at each time point. (E) Experimental timeline of engraftment and infection in days. 17 well-engrafted mice were infected with HIV-Cre. At 12 dpi, mice were either treated with antiretroviral (ART) therapy or left untreated, and plasma viremia was determined for each mouse over the course of the infection. F Plasma viremia (copies/ml) for infected mice as determined by RT-qPCR assay specific for HIV-1 (n = 7). Plasma viremia (copies/ml) for infected and treated mice as determined by RT-qPCR assay specific for HIV-1 (n = 10). The red dotted line depicts the limit of detection (~300 copies/ml) for the RT-qPCR assay. The olive-green shaded box shows the duration of ART treatment. G The change in CD4/CD8 ratio was plotted over time following infection. The CD4/CD8 ratio changes over time in infected and ART-treated mice. The black dotted line represents the fractional deviation from the starting CD4/CD8 ratio, set to 1 for each animal. H Graph showing percentage switching normalized to total transduced (dsRed) targets in peripheral blood for infected HILT mice (n = 6, bars indicate mean +/− SD). I Plasma viremia (copies/ml) for infected mice as determined by RT-qPCR assay specific for HIV-1. (Infected mice n = 6, uninfected mice, n = 3). The dotted line indicates the background detection level of the assay.
Fig. 3
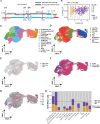
Fig. 3. Single-cell RNA sequencing identifies HIV-1 transcripts in HILT mice.
A Segmented HIV Cre I genome with HIV transcript and overlap annotations (blue and red) used in the 10x Genomics Cell Ranger Count custom reference. Locations of splice donors (D1 and D4) and acceptors (A1 and A7) within the genome of HIV Cre I are determined based on splice sites within the HIV-1 genome53. B Representative scatter plot of total HIV UMIs detected in cells across acutely infected and treated mice in proportion to total cellular UMI counts. Cells with >2 transcripts were defined as HIV RNA+ (n = 989). HIV RNA+ low with a range of 2 to 10 HIV transcripts per cell (n = 479) and HIV RNA+ high encompassing cells with >11 transcripts (n = 510). UMAP of all cells (n = 40,782). Cells were colored based on identified cell type (C), predicted cell type (D), HIV RNA status (E), experimental condition (F), and mouse ID (G). (Mouse ID: A1-A3 acutely infected mice, T1-T3 ART-treated mice, U1-U2 uninfected mice) (H) Bar plots representing HIV-1 RNA+ high and HIV RNA+ low cells across identified CD4 T cell subsets. The black dotted line shows the average distribution of HIV RNA+ cells (two-sided Fisher exact test: p = 0.0005).
Fig. 4
Fig. 4. Distribution of HIV Transcript positive cells and HILT marking of putative latent cells across CD4 T-cell subsets in acutely infected and ART-treated humanized mice.
Distribution of HIV-1 RNA across diverse CD4 T-cell clusters in acutely infected HILT mice and GFP+ cells are enriched among clusters within ART-treated mice (A) UMAP of cells from acutely infected mice A1-3 (n = 17,346) highlighting cell types. B UMAP highlighting the location of HIV RNA+ cells with high or low transcript detection (n = 985). C UMAP of cells for representative ART-treated mice T1/T2 (n = 8503) highlighting identified cell types. D UMAP highlighting the location of HILT-marked GFP+, putative latently infected cells (n = 37). E Number of HIV RNA+ cells isolated from each mouse in the pooled analysis, acutely infected (A1-A3), ART-treated (T1-T3), and uninfected mice (U1-U2). F Proportion of cell types within acutely infected and ART-treated mice datasets (two-sided Fisher exact test, p = 0.0005). The black dotted lines show the average percentage GFP+ across all T cells. G Distribution of HIV RNA+ cells within identified cell types within the acute dataset (two-sided Fisher exact test: p = 0.0005). H The deviation from the mean % HIV RNA+ cells among all cells, represented as a log2-fold change for each cluster. I Distribution of HILT-marked GFP+ cells within identified cell types (two-sided Fisher exact test: p = 0.0025). The black dotted lines show the average percentage of GFP+ across all T cells. Within the ART-treated mice, the percentage of GFP+ (putative latent) is represented for each cluster. J The deviation from the mean % GFP+ cells among all cells for each cluster represented as a log2-fold change.
Fig. 5
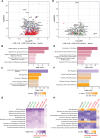
Fig. 5. Differential gene expression analysis of cells within acute and ART-treated datasets reveals distinct transcriptional patterns in overlapping pathways.
A Volcano Plot for DGE analysis of HIV RNA+ high vs HIV RNA- cells in 15 dpi acutely infected mouse ID A3. Red-colored dots represent any differentially expressed gene <0.05 FDR, while blue color dots represent genes with <0.05 FDR found in all three datasets of acutely infected mice (common genes). B Enrichr gene set enrichment analysis of common genes within acutely infected mice displaying top 5 gene sets by -log p-value (one-sided Fisher’s exact test, Benjamini-Hochberg multiple testing correction). C IPA analysis of the top 5 enriched canonical pathways by p-value (one-sided Fisher’s exact test, Benjamini-Hochberg multiple testing correction) and colored by z-score. D Volcano Plot for HILT marked dsRed-/GFP+ cells vs HILT marked dsRed+/GFP- cells within 10-days and 29-days ART-treated mice T1/T2. Red dots represent any differentially expressed gene <0.05 FDR threshold, while green color dots represent genes <0.05 FDR found in all mice. E Enrichr gene set enrichment analysis of common genes within ART-treated mice displaying top 5 gene sets by -log p-value (one-sided Fisher’s exact test, Benjamini-Hochberg multiple testing correction). F IPA shows the top 5 enriched canonical pathways by p-value (one-sided Fisher’s exact test, Benjamini-Hochberg multiple testing correction) and colored by z-score in ART-treated mice. Pathway comparison analysis of total CD4 cells and subsets of CD4 cells sorted by -log pvalue (one-sided Fisher’s exact test, Benjamini-Hochberg multiple testing correction) (G) and z-score (H). HIV RNA+ high cells (n = 508) from acutely infected mice vs uninfected dsRed+/GFP- cells (n = 7504) from uninfected mice U1/U2 with HILT-marked GFP+ cells vs HILT marked dsRed+/GFP- cells within 10-days and 29-days ART-treated mice T1/T2 were used.
Fig. 6
Fig. 6. Comparison analysis of pathways in acutely infected human T cells and humanized mice comparing acutely infected with latently infected T cells.
IPA pathway comparison analysis of between HIV-1 RNA+ cells of Collora et al., 2022 dataset and HIV-1 RNA+ cells from Total CD4 T-cells in our dataset represented in heatmap showing -log P-value (one-sided Fisher’s exact test, Benjamini-Hochberg multiple testing correction) (A), and Z-score (B). C Comparison of top canonical pathways ranked by -log p-value across acutely infected mice A1-A3 and ART-treated mice T1/T2 (one-sided Fisher’s exact test, Benjamini-Hochberg multiple testing correction). Expression log ratio represented in heatmaps of selected genes within EIF2 signaling (D), Sirtuin Signaling (E), and Protein Ubiquitination Pathway (F) across DEG of HIV RNA+ high vs. HIV RNA- cells within three acute (A1-A3) and GFP+ vs dsRed+/GFP- cells of two ART-treated mice datasets (T1/T2). The negative expression log ratio is colored blue, while the high is yellow, indicating a positive expression log ratio.

References

    1. Ho, D. D. et al. Rapid turnover of plasma virions and CD4 lymphocytes in HIV-1 infection. Nature373, 123–126 (1995). - PubMed
    1. Perelson, A. S., Neumann, A. U., Markowitz, M., Leonard, J. M. & Ho, D. D. HIV-1 dynamics in vivo: virion clearance rate, infected cell life-span, and viral generation time. Science271, 1582–1586 (1996). - PubMed
    1. Palella, F. J. Jr. et al. Declining morbidity and mortality among patients with advanced human immunodeficiency virus infection. HIV Outpatient Study Investig. N. Engl. J. Med.338, 853–860 (1998). - PubMed
    1. Sengupta, S. & Siliciano, R. F. Targeting the latent reservoir for HIV-1. Immunity48, 872–895 (2018). - PMC - PubMed
    1. Davenport, M. P. et al. Functional cure of HIV: the scale of the challenge. Nat. Rev. Immunol.19, 45–54 (2019). - PubMed