Comparative Study
. 2025 Mar 6;16(1):2231.
doi: 10.1038/s41467-025-57374-9.

A fast approach for structural and evolutionary analysis based on energetic profile protein comparison

Affiliations
Comparative Study

A fast approach for structural and evolutionary analysis based on energetic profile protein comparison

Peyman Choopanian et al. Nat Commun. .

Erratum in

Abstract

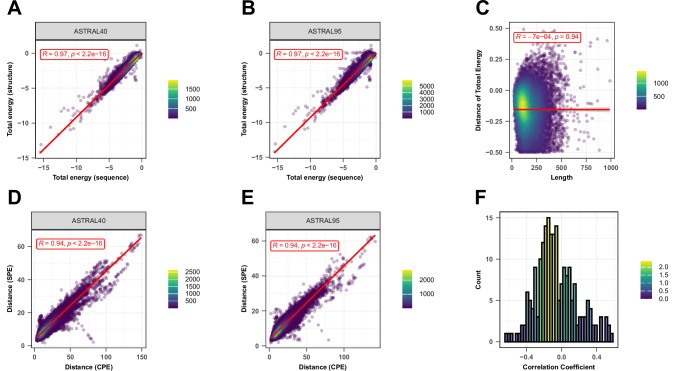
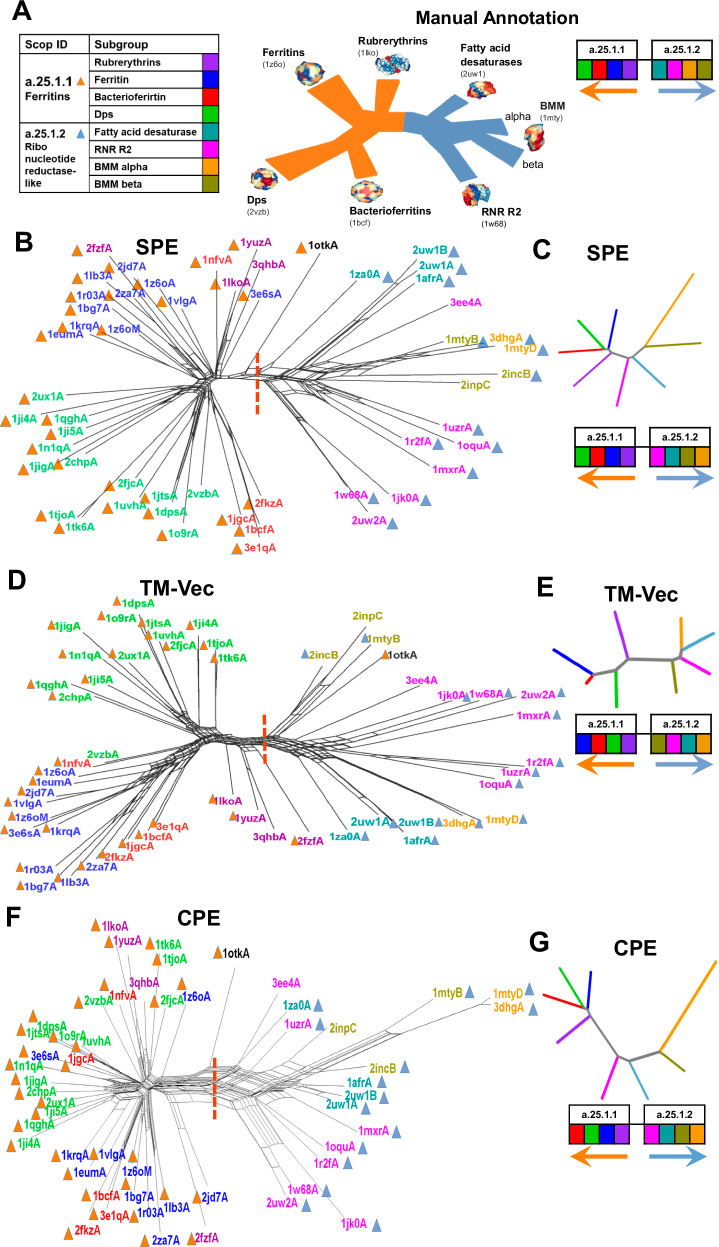
In structural bioinformatics, the efficiency of predicting protein similarity, function, and evolutionary relationships is crucial. Our approach proposed herein leverages protein energy profiles derived from a knowledge-based potential, deviating from traditional methods relying on structural alignment or atomic distances. This method assigns unique energy profiles to individual proteins, facilitating rapid comparative analysis for both structural similarities and evolutionary relationships across various hierarchical levels. Our study demonstrates that energy profiles contain substantial information about protein structure at class, fold, superfamily, and family levels. Notably, these profiles accurately distinguish proteins across species, illustrated by the classification of coronavirus spike glycoproteins and bacteriocin proteins. Introducing a separation measure based on energy profile similarity, our method shows significant correlation with a network-based approach, emphasizing the potential of energy profiles as efficient predictors for drug combinations with faster computational requirements. Our key insight is that the sequence-based energy profile strongly correlates with structure-derived energy, enabling rapid and efficient protein comparisons based solely on sequences.


Conflict of interest statement

Competing interests: The authors declare no competing interests.

Figures

Fig. 1
Fig. 1. Development of knowledge-based potential function and profile of energy.
A Construction of the knowledge-based potential function. B Estimation of the predictor matrix P. C Construction of the structural profile of energy (SPE) based on protein structure. D Construction of the compositional profile of energy (CPE) based on protein sequence.
Fig. 2
Fig. 2. Sequence-Structure relationship.
Two-sided Pearson correlation comparing total energy estimates derived from protein sequence (X-axis) and protein structure (Y-axis) for protein domains in the (A) ASTRAL40 data set and (B) ASTRAL95 dataset. C Two-sided Pearson correlation between the difference in total energy from sequence and structure (Y-axis) and protein length (X-axis). The red lines represent the least squares regression line, and the gray shaded area represents the 95% confidence intervals around the regression line. Each point in (AC) represents a protein domain. Two-sided Pearson correlation comparing the distances of profile of energy derived from sequence (X-axis) and structure (Y-axis) for all pairs of domains in D) ASTRAL40 and E) ASTRAL95 datasets, respectively. Each point in (D, E) represents a pair of protein domain. In plots (AD), R indicates the correlation coefficient, and p shows the p-value. The exact p-value is less than 10e-16, which is below the precision threshold of standard statistical computations. F Histogram showing the distribution of correlation coefficients between the difference in energy estimates (from sequence and structure) and protein length across all 210 pairwise interactions. Source data are provided as a Source Data file.
Fig. 3
Fig. 3. UMAP Visualization of Energy Profiles.
The UMAP projection of structural profile of energy (SPE) and Compositional Energy Profiles (CPE) of protein domains from ASTRAL40 and ASTRAL95 represents the structural information embedded in energy profiles across hierarchical levels of SCOP; each panel includes two figures, one generated by CPE (left panel) and the other by SPE (right panel), revealing that protein domains sharing the same (A) fold, (B) superfamily, and (C) family exhibit comparable energy profile patterns. The folds a.100 and a.104, superfamilies a.29.2 and a.29.3, as well as families a.25.1.0 and a.25.1.2, are randomly selected for analysis, and the UMAP plots were generated using parameters n_neighbors = 30 and min_dist = 0.1. Source data are provided as a Source Data file.
Fig. 4
Fig. 4. Performance and Computational Efficiency of Protein Dissimilarity Measures.
A Time versus accuracy for the 1-NN classifier using GR-Align, RMSD, TM-score, Yau-Hausdorff distance, TM-Vec, and the distance between energy profiles SPE and CPE as measures of protein dissimilarity. B Running times of the evaluated methods, scaled to 12 h, with an inset zooming in on the region indicated by the dashed circle. The entire circle represents 80 s. Each method is represented by different colors as indicated in the figure legend. C The UMAP projection of α and β globins from the hemoglobin biological unit using CPE, SPE, and TM-Vec representations. n_neighbors = 13, min_dist = 0.1. Source data are provided as a Source Data file.
Fig. 5
Fig. 5. Phylogenetic network reconstruction of the ferritin-like superfamily.
A Schematic representation of the relationships among major ferritin-like protein families, with each subgroup shown in a distinct color. B Phylogenetic network reconstructed using SPE. C Neighbor-joining tree generated based on the average distances between subgroups using SPE. D Phylogenetic network reconstructed using TM-Vec. E Neighbor-joining tree generated using the average distances between subgroups with TM-Vec. F Phylogenetic network reconstructed using CPE. G Neighbor-joining tree based on the average distances between subgroups using CPE. The red dotted line highlights the separation between two SCOP families: ferritins (SCOP ID a.25.1.1), which includes the Bacterioferritin, Ferritins, Dps, and Rubrerythrin subgroups, and the Ribonucleotide Reductase-like family (SCOP ID a.25.1.2), which includes the BMM-alpha, BMM-beta, Fatty_acid, and RNRR2 subgroups. The inferred arrangement of subfamilies using each method is shown to the right of (C, E, G). Source data are provided as a Source Data file.
Fig. 6
Fig. 6. Clustering analysis of spike glycoprotein structures from SARS-CoV, SARS-CoV-2, and MERS-CoV.
The dendrograms depict the clustering of spike glycoprotein structures from the three viruses: SARS-CoV, SARS-CoV-2, and MERS-CoV. The clustering is based on pairwise distances calculated from different methods: (A) protein sequence, (B) CPE, (C) TM-Vec, (D) SPE, (E) RMSD, and (F) TM-Score. The leaves of each tree are color-coded to indicate the originating virus for each spike glycoprotein structure. G Displays the ARI values for each method,(H) shows the running time associated with each method scaled to 12 h, with an inset zooming in on the region indicated by the dashed circle. The entire circle represents 80 s, and (I) presents the average distance between the three virus groups as calculated by each method. Source data are provided as a Source Data file.
Fig. 7
Fig. 7. UMAP Projection of Energy Profiles for Bacteriocins and Betacoronavirus Domains, with Distance Comparisons and Scalability Analysis.
A UMAP projection of Compositional Energy Profiles (CPE) for 690 peptides, representing three different classes of bacteriocins. B Comparison of CPE distances with the TM-scores produced by running TM-align on structures predicted by AlphaFold2, OmegaFold and ESMFold, and TM-Vec for all pairs of bacteriocins, pairs at different classes (n = 125869), pairs at the same class (n = 111349), pairs from the same class from subclass1 (n = 13431). Statistics assessed by two-tailed Student’s t-test. Boxplots display the median (center line), the 25th and 75th percentiles (bounds of the box), and the minimum and maximum values (whiskers) excluding outliers. Comparisons of CPE distances revealed statistically significant differences across the groups (different class, same class, and subclass1 within the same class), with p-values for all three tests being <10e−16. The exact p-value is less than 10e-16, which is below the precision threshold of standard statistical computations. CPE distances are normalized by min-max normalization. C Papain-like Protease (PLPro) domains across Betacoronavirus subgenera. The UMAP projection shows clustering of PLPro domains from Sarbecovirus (n = 31), Nobecovirus (n = 11), Merbecovirus (n = 34), and Embecovirus (n = 45) using SPE, CPE, and TMVec representations. n_neighbors = 13, min_dist = 0.5. D Two-sided Pearson correlation comparing Protein-Protein Interaction Network Distances (X-axis) with Energy Profile Distances (Y-axis). The blue line illustrates the least squares regression line, and the gray shaded area represents the 95% confidence intervals around the regression line. Each point corresponds to a drug combination. R indicates the correlation coefficient, and p shows the p-value. E Scalability of CPE and TM-Vec. Processing time per amino acid for subsets from the ASTRAL95 dataset, ranging in size from 1000 to 30,000 proteins (at intervals of 5000). Source data are provided as a Source Data file.

References

    1. Sayers, E. W. et al. Database resources of the national center for biotechnology information. Nucleic acids Res.49, D10 (2021). - PMC - PubMed
    1. Altschul, S. F. et al. Gapped BLAST and PSI-BLAST: a new generation of protein database search programs. Nucleic acids Res.25, 3389–3402 (1997). - PMC - PubMed
    1. Kilinc, M., Jia, K. & Jernigan, R. L. Improved global protein homolog detection with major gains in function identification. Proc. Natl Acad. Sci.120, e2211823120 (2023). - PMC - PubMed
    1. Quan, Y. et al. Evolution-strengthened knowledge graph enables predicting the targetability and druggability of genes. PNAS nexus2, pgad147 (2023). - PMC - PubMed
    1. Du, Z. et al. pLM4ACE: A protein language model based predictor for antihypertensive peptide screening. Food Chem.431, 137162 (2024). - PubMed

Publication types

MeSH terms

LinkOut - more resources