

A subcortical switchboard for perseverative, exploratory and disengaged states
- PMID: 40044848
- PMCID: PMC12043504
- DOI: 10.1038/s41586-025-08672-1
A subcortical switchboard for perseverative, exploratory and disengaged states
Abstract
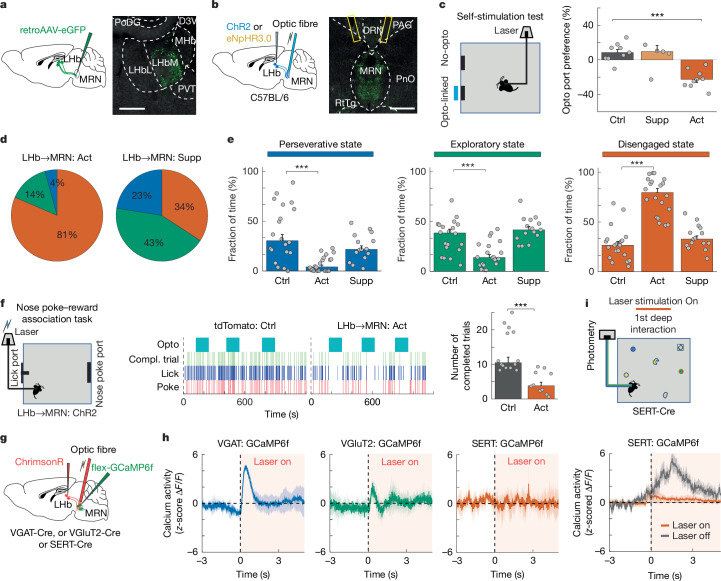
To survive in dynamic environments with uncertain resources, animals must adapt their behaviour flexibly, choosing strategies such as persevering with a current choice, exploring alternatives or disengaging altogether. Previous studies have mainly investigated how forebrain regions represent choice costs and values as well as optimal strategies during such decisions1-5. However, the neural mechanisms by which the brain implements alternative behavioural strategies such as persevering, exploring or disengaging remain poorly understood. Here we identify a neural hub that is critical for flexible switching between behavioural strategies, the median raphe nucleus (MRN). Using cell-type-specific optogenetic manipulations, fibre photometry and circuit tracing in mice performing diverse instinctive and learnt behaviours, we found that the main cell types of the MRN-GABAergic (γ-aminobutyric acid-expressing), glutamatergic (VGluT2+) and serotonergic neurons-have complementary functions and regulate perseverance, exploration and disengagement, respectively. Suppression of MRN GABAergic neurons-for instance, through inhibitory input from lateral hypothalamus, which conveys strong positive valence to the MRN-leads to perseverative behaviour. By contrast, activation of MRN VGluT2+ neurons drives exploration. Activity of serotonergic MRN neurons is necessary for general task engagement. Input from the lateral habenula that conveys negative valence suppresses serotonergic MRN neurons, leading to disengagement. These findings establish the MRN as a central behavioural switchboard that is uniquely positioned to flexibly control behavioural strategies. These circuits thus may also have an important role in the aetiology of major mental pathologies such as depressive or obsessive-compulsive disorders.
© 2025. The Author(s).
Conflict of interest statement
Competing interests: The authors declare no competing interests.
Figures


References
-
- Tervo, D. et al. The anterior cingulate cortex directs exploration of alternative strategies. Neuron109, 1876–1887 (2021). - PubMed
MeSH terms
Substances
Grants and funding
LinkOut - more resources
Full Text Sources
