. 2025 May;641(8063):681-689.
doi: 10.1038/s41586-025-08625-8. Epub 2025 Mar 5.

Clonal dynamics and somatic evolution of haematopoiesis in mouse

Affiliations

Clonal dynamics and somatic evolution of haematopoiesis in mouse

Chiraag D Kapadia et al. Nature. 2025 May.

Erratum in

  • Author Correction: Clonal dynamics and somatic evolution of haematopoiesis in mouse.
    Kapadia CD, Williams N, Dawson KJ, Watson C, Yousefzadeh MJ, Le D, Nyamondo K, Kodavali S, Cagan A, Waldvogel S, Zhang X, De La Fuente J, Leongamornlert D, Mitchell E, Florez MA, Sosnowski K, Aguilar R, Martell A, Guzman A, Harrison D, Niedernhofer LJ, King KY, Campbell PJ, Blundell J, Goodell MA, Nangalia J. Kapadia CD, et al. Nature. 2025 Oct;646(8086):E13. doi: 10.1038/s41586-025-09635-2. Nature. 2025. PMID: 40973831 Free PMC article. No abstract available.

Abstract

Haematopoietic stem cells maintain blood production throughout life1. Although extensively characterized using the laboratory mouse, little is known about clonal selection and population dynamics of the haematopoietic stem cell pool during murine ageing. We isolated stem cells and progenitors from young and old mice, identifying 221,890 somatic mutations genome-wide in 1,845 single-cell-derived colonies. Mouse stem cells and progenitors accrue approximately 45 somatic mutations per year, a rate only approximately threefold greater than human progenitors despite the vastly different organismal sizes and lifespans. Phylogenetic patterns show that stem and multipotent progenitor cell pools are established during embryogenesis, after which they independently self-renew in parallel over life, evenly contributing to differentiated progenitors and peripheral blood. The stem cell pool grows steadily over the mouse lifespan to about 70,000 cells, self-renewing about every 6 weeks. Aged mice did not display the profound loss of clonal diversity characteristic of human haematopoietic ageing. However, targeted sequencing showed small, expanded clones in the context of murine ageing, which were larger and more numerous following haematological perturbations, exhibiting a selection landscape similar to humans. Our data illustrate both conserved features of population dynamics of blood and distinct patterns of age-associated somatic evolution in the short-lived mouse.


Conflict of interest statement

Competing interests: The authors declare no competing interests.

Figures

Fig. 1
Fig. 1. Somatic mutations in murine stem cell-derived haematopoietic colonies.
a, Study approach. Top, single-cell-derived colony WGS of long-term HSCs and MPPs to study somatic mutations, lineage relationships and population dynamics. Bottom, targeted duplex-sequencing of peripheral blood to identify small clonal expansions and fitness landscapes. b, Number of whole genomes (n = 1,305) of HSC- and MPP-derived colonies that underwent phylogenetic construction for each female mouse (n = 6). Plots are coloured according to HSC- or MPP-derived colonies, darker and lighter shades, respectively. c, Burden of individual SBSs observed in HSCs (n = 908) from each donor. Points denote single HSCs, and horizontal lines denote median sample burden, coloured per sample as in b. Line shows linear mixed-effect regression of mutation burden observed in colonies. Shaded areas indicate the 95% CI. d, Comparison of SBS burden between HSC- and MPP-derived colonies from the same mice. SBS burden from HSCs is shown as circles, and burden from MPPs is shown as squares. Horizontal lines depict median burden. The exact number of HSC and MPP colonies for each sample is as listed in b. H, HSC; M, MPP, shown above animal ID. e, SBS burden across HSCs (data as in c), whole blood and individual colonic crypts in the three aged mice. Bar height represents mean SBS burden, and error bars denote 95% CI. Peripheral blood and colonic crypt somatic mutation burdens were measured with nanorate sequencing and WGS, respectively. HSC colony counts per sample are described in b; nanorate sequencing results are from a single replicate per animal, and n = 6, 5 and 5 colonic crypts for M7180, M7181 and M7182.
Fig. 2
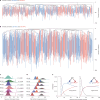
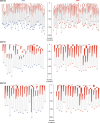
Fig. 2. Phylogenetic trees of HSCs and MPPs from a young mouse and an old mouse.
a,b, Phylogenetic trees of a young mouse (3 months; a) and an aged mouse (30 months; b) depicting the pattern of sharing of somatic mutations among HSC (blue) and MPP (red) colonies. Each tip represents a single colony. Branch lengths represent mutation number, corrected for sensitivity for mutation detection. Branch colours reflect the identity of descendent colonies (Supplementary Note 2). c, Phylogenetic relatedness of HSCs and MPPs, quantified as HSC–MPP intermixing within clades established after 25 mutations molecular time. The mixing metric for a clade is the absolute difference between the proportion of HSCs in a clade and the expected value under equal sampling, averaged for all clades in a phylogeny. The vertical bar denotes the observed mixing metric; the filled distributions reflect mixing metrics expected by random chance, estimated by reshuffling the HSC/MPP tip states. One-tailed significance values are derived from the rank of the observed metric in the corresponding reshuffled distribution, with no adjustment for several comparisons between samples. d, Distributions of the number of cell identity changes required per colony to capture the observed tip states. The number of cell identity changes assuming a unidirectional ‘HSC-first’ model (HSCs give rise to MPPs) is shown in blue. The required cell identity changes for the opposite ‘MPP-first’ model, in which MPPs give rise to HSCs, is shown in red. The null distribution, in which tip states are randomly reshuffled, is shown in grey. e, Cell-type probability trajectories from a three-state ontogeny model in which EMBs differentiate to HSCs or MPPs, followed by HSC-to-MPP or MPP-to-HSC transitions. The displayed trajectories for 30-month (right) and 3-month (left) donors are based on iterating the hidden Markov model starting at EMB. Thickness of arrows reflect the proportion of overall transitions between states; transition rates are derived in Supplementary Note 2.
Fig. 3
Fig. 3. Population dynamics and selection in the murine stem cells.
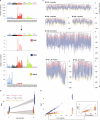
a, Population trajectories estimated separately in HSCs and MPPs using Bayesian phylodynamics for the six samples shown in Fig. 2a,b and Extended Data Fig. 2. The dark blue (HSC) and red (MPP) lines indicate the mean effective population trajectory; shaded areas are 95% CIs. Vertical dashed lines separate trajectories into early life and adulthood age periods, in which different population size behaviours are observed. Inset values indicate posterior density estimates of population size (N), symmetric cell division rate per week (λ) and their ratio (N/λ) in HSC-years, as derived from ABCs. b, Haematopoietic stem and progenitor cell (HSPC) prevalence during murine ageing. The relative abundance of total HSPCs (left, defined as the LSK compartment) and individual HSPC subpopulations (right) are compared. Bar height denotes mean among samples (individual dots); error bars denote s.e.m. Each data point per timepoint is a biologically independent animal examined over two independent experiments. MPPLy are lymphoid-biased progenitors, MPPGM are myeloid-biased progenitors, based on current immunophenotypic definitions. WBM, whole bone marrow. c, Shannon diversity index for each phylogeny calculated using the number and size of unique clades present at 50 mutations molecular time. Mouse points are coloured as in Fig. 1b. Grey dots depict results from data published in ref. . d, dN/dS for somatic mutations observed across aged and young animals overlaps with 1, indicating no departure from neutrality. Error bars denote 95% CI.
Fig. 4
Fig. 4. Clonal haematopoiesis during normal ageing in mouse.
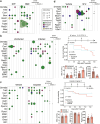
a, Dot-plot describing incidence of clonal haematopoiesis in mice at increasing age. Each vertical column represents a single mouse sample with detected clone size and consequence indicated by dot size and colour. Strain is C57BL/6J. b, Bar plot summarizing clone count per sample as illustrated in a. Bar height represents mean clone count. Differences in clone incidence were quantified by the Kruskal–Wallis test. ** denotes P = 0.0067, and **** denotes P < 0.0001, with correction for several hypothesis testing. NS, not significant. c,d, Murine clonal haematopoiesis incidence in the laboratory strains B6FVBF1/J (F1 hybrid from crossing inbred C57BL/6J × FVB/NJ; c) and HET3 (a four-way cross between C57BL/6J, BALB/cByJ, C3H/HeJ and DBA/2J; d). e, Clone size changes in samples collected serially over 4 months. Clones are coloured by mutation. f, dN/dS ratios for targeted genes mutated in murine clonal haematopoiesis. Variants from all donors in a were used to determine gene-level dN/dS ratios. * represents dN/dS greater than 1 with q value < 0.1.
Fig. 5
Fig. 5. The fitness landscape of known drivers of clonal haematopoiesis.
a, Reverse cumulative density for all synonymous (including flanking intronic regions in targeted baitset) and non-synonymous somatic variants detected using duplex sequencing from mice aged 24–25 months, arranged by increased VAF. The relative density of synonymous (and flanking intronic) variants, which are assumed to have neutral fitness, yields an estimate for N/λ, the ratio of population size and symmetric cell division rate (per year). The synonymous and non-synonymous mutation rates (μ, bp per year) can then be estimated using a maximum-likelihood approach. b, Distribution of fitness effects for non-synonymous mutations.
Extended Data Fig. 1
Extended Data Fig. 1. Cell isolation strategy and quality control.
a) Sorting strategy for single HSCs and MPPs from young and aged mice. Progenitor-enriched bone marrow was stained as described in the Methods, and then single cells were sorted into individual wells for in vitro expansion. b) Colony-forming efficiency of sorted HSCs and MPPs for each sample. Each bar represents the listed cell type and underlying sample ID. c) Variant allele fraction (VAF) distribution of all variants within a colony that pass filtering, shown for a representative clonal colony that passed sample QC (left) and a non-clonal colony that passed sample QC (right). After variant filtration, the VAF distribution of a colony’s variants is centred around 50% in clonal colonies, but less than 50% in non-clonal colonies. d) Representative image of two colonic crypts isolated by laser capture microdissection. e) Correlation between total single base substitution burden and depth, for all colonies from sample M7180, shown before (left) and after (right) sequencing depth correction. Shaded area denotes 95% confidence interval. f) Trinucleotide spectra from aggregated somatic mutations mapped to shared (truncal) or private branches of phylogenetic trees. Signatures are highly similar, suggesting artefacts are not relatively enriched in either portion of reconstructed trees.
Extended Data Fig. 2
Extended Data Fig. 2. Additional phylogenetic trees from young and aged mice.
Phylogenies for a-b) 2 additional young (3-month) mice and c-d) 2 additional aged mice (30-month), presented as described in Fig. 2.
Extended Data Fig. 3
Extended Data Fig. 3. Early-in-life phylogenetic patterns and cross-tissue mutations.
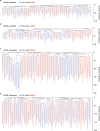
Phylogenies from aged (left) and young (right) HSCs zoomed into the first 12 mutations molecular time. Polytomies in the branching structure, which represent cell division without mutation acquisition, are enriched among early-in-life cell divisions at the tops of the phylogenies. Variants shared with matched colonic crypts are layered onto the trees as pie charts. Pie chart fullness represents the proportion of colonic crypts in which the mutation present on the haematopoietic phylogeny was observed. Sample M7183 lacked sufficient early life diversity (<10 unique lineages within 12 mutations molecular time) and was excluded.
Extended Data Fig. 4
Extended Data Fig. 4. Mutational processes in murine stem cells.
a) Signature extraction overview. Trinucleotide spectra from all single-base substitutions (SBS) (top), were used for signature extraction as described in the Methods. Three signatures identified as SBS1, SBS5, and SBS18 best described the catalogue of mutations observed (cosine similarity=0.997). b) Linear mixed-effect regression of signature-specific mutation burdens observed in colonies. Shaded areas indicate the 95% confidence interval. c) Signature attribution in phylogenies. Individual branches of HSC phylogenies are overlaid with signature contribution proportions. SBSs assigned to each branch were fit to SBS1, SBS5 or SBS18. d) Signature-specific mutation accumulation in all branches across phylogenies. Early-life branchpoints, located at the top of a given phylogeny, and shown as an inset.
Extended Data Fig. 5
Extended Data Fig. 5. Phylogeny comparison between aged human and mouse.
a) Representative ultrametric phylogenies from the three oldest humans described in Mitchell et al.. The published trees have been randomly downsampled to 100 colonies (tips). b) Aged mouse phylogenies, also downsampled to 100 colonies, to allow comparison of topological structure. The median lifespan for human and mouse species are labelled and were derived as described in Supplementary Note 1. Full murine phylogenetic trees are shown in Fig. 2a,b and Extended Data Fig. 2.
Extended Data Fig. 6
Extended Data Fig. 6. Approximate Bayesian inferences.
Results from approximate Bayesian computation (ABC) inference of a) population size (N), b) symmetric division rate per week (λ), and c) death rate per week (ν) for the three 30-month-old mice. Blue lines represent the prior density of parameters; red lines represent the posterior densities. Median posterior density estimates and 95% credibility intervals are displayed for each parameter per sample. The prior density for the death rate was bounded to ensure the growth rate (λν) remained positive, as observed in phylodyn trajectories in Fig. 3. d) Joint density distributions indicating optimal parameters of population size and division rates that explain observed phylogenetic trees. The estimated N/λ, in HSC-years, is shown with 95% credibility intervals. Data from the three aged mice are shown.
Extended Data Fig. 7
Extended Data Fig. 7. Extended phylogenetic trees including early progenitors.
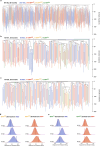
a-c) Extended phylogenies for three 30-month mice using the pattern of sharing of somatic mutations among HSCs (blue), MPPs (red), and the mixed LSK (Lineage-, Sca1+, c-kit+) haematopoietic progenitor compartment. The LSK compartment contains HSCs and MPP, and additionally contains the myeloid-biased MPPGM (orange) and lymphoid-biased MPPLy populations (green). LSK subcompartments were identified at time of single cell sorting using a consensus definition. Each tip represents a single colony. Branch lengths represent mutation numbers. d-e) Clade mixing metrics for MPPGM and MPPLy colonies used to evaluate interrelatedness with HSC and MPP. HSC, MPP and MPPGM or MPPLy were designated as being in the same clade if they shared a most recent common ancestor after 25 mutations, corresponding to early foetal development. Only clades with more than 3 colonies are considered. The vertical bar reflects the average clade mixing metric observed in the constructed phylogenies, while distributions reflect the average clade mixing metric expected random chance, estimated by reshuffling the tip states. If the observed value (vertical bar) significantly deviated from random chance (filled distribution), then there would be minimal overlap between the observed data and the random reshuffling distribution. The average clade mixing metric for MPPGM compared to HSCs (blue) and MPPs (red) is shown in d). The similar measure of interrelatedness of MPPLy to HSCs and MPPs is shown in e). All one tailed significance values in d) and e) were p > 0.05 and were derived from the rank of the observed metric in the corresponding reshuffled distribution.
Extended Data Fig. 8
Extended Data Fig. 8. Mutation overlap between phylogenies and peripheral blood.
a) Phylogenies for three aged mice (as described in Extended Data Fig. 7a–c) constructed to only include private branches targeted with the peripheral blood baitset. Branch shading indicates the maximum VAF among branch-specific variants captured in peripheral blood. The sampled cell immunophenotype is indicated by dot colour at the bottom of each private branch. b) VAF trajectories of HSC and MPP variants shared in peripheral blood. The aggregate VAF across molecular time is calculated using Gibbs sampling (Methods). Earlier molecular time corresponds to further in the ancestral past. Shaded regions denote 95% confidence intervals of VAF estimates.
Extended Data Fig. 9
Extended Data Fig. 9. Peripheral blood VAF of variants shared with HSCs and MPPs.
Baitset mutation-specific HSC and MPP phylogenies are shown for each 30-month mouse. Each branch shows mutations that were detected in peripheral blood in descending VAF order. On each branch, a row denotes a single variant mapped to that specific branch. Red fill denotes the peripheral blood VAF for the variant. VAF is denoted on a log scale from 10-5 to 1; internal divisions are marked from left to right at VAF 0.0001, 0.001, 0.01, and 0.1. HSC trees are shown on the left with blue dots at terminal branches; MPP trees are shown on the right with red dots. Trees are downsampled to allow equivalent comparison between HSC and MPP branches. Only variants seen in peripheral blood with a depth > 100X are shown.
Extended Data Fig. 10
Extended Data Fig. 10. Haematopoietic perturbation modulates selection landscapes.
Clonal haematopoiesis prevalence in aged mice following a) normalized microbial experience (NME), b) M. avium infection, c) cisplatin treatment, and d) 5-FU myeloablation. At final sampling, aged mice were 30 months old for the NME experiments in panel a), and were 25 months old for the perturbation experiments in panels b), c), and d). Enrichment of clonal prevalence (measured using a two-sided Mann-Whitney test) and dN/dS ratios departing from parity (q < 0.1) following treatment are shown for each gene. Within b), significance values for Tet2, Bcor, and Asxl1 are 0.047, 0.046, 0.046, respectively. Within c) significance values for Tet2, Asxl1, and Trp53 are 0.025, 0.049, 0.037, respectively. Within d), significance values for Cux1 and Bcor are 0.022 and 0.007, respectively. Survival curves and experimental endpoint blood counts are displayed for b) and c), using log-rank and two-sided t tests, respectively. For blood count data, bar height denotes the mean among samples (individual dots), error bars denote SEM, and each data point is a biologically independent animal aggregated from 2 independent treatment cohorts. * denotes p-value < 0.05 and ** denotes p-value < 0.01, with no correction for multiple hypothesis testing. Treatment schedules are as displayed or described in Methods.

Update of

References

    1. Sender, R. & Milo, R. The distribution of cellular turnover in the human body. Nat. Med.27, 45–48 (2021). - PubMed
    1. Patel, S. H. et al. Lifelong multilineage contribution by embryonic-born blood progenitors. Nature606, 747–753 (2022). - PubMed
    1. Sun, J. et al. Clonal dynamics of native haematopoiesis. Nature514, 322–327 (2014). - PMC - PubMed
    1. Kucinski, I. et al. A time- and single-cell-resolved model of murine bone marrow hematopoiesis. Cell Stem Cell31, 244–259.e10 (2024). - PMC - PubMed
    1. Mitchell, E. et al. Clonal dynamics of haematopoiesis across the human lifespan. Nature606, 343–350 (2022). - PMC - PubMed

MeSH terms

LinkOut - more resources