. 2025 Apr;640(8060):1052-1061.
doi: 10.1038/s41586-025-08626-7. Epub 2025 Mar 5.

Aspirin prevents metastasis by limiting platelet TXA2 suppression of T cell immunity

Affiliations

Aspirin prevents metastasis by limiting platelet TXA2 suppression of T cell immunity

Jie Yang et al. Nature. 2025 Apr.

Abstract

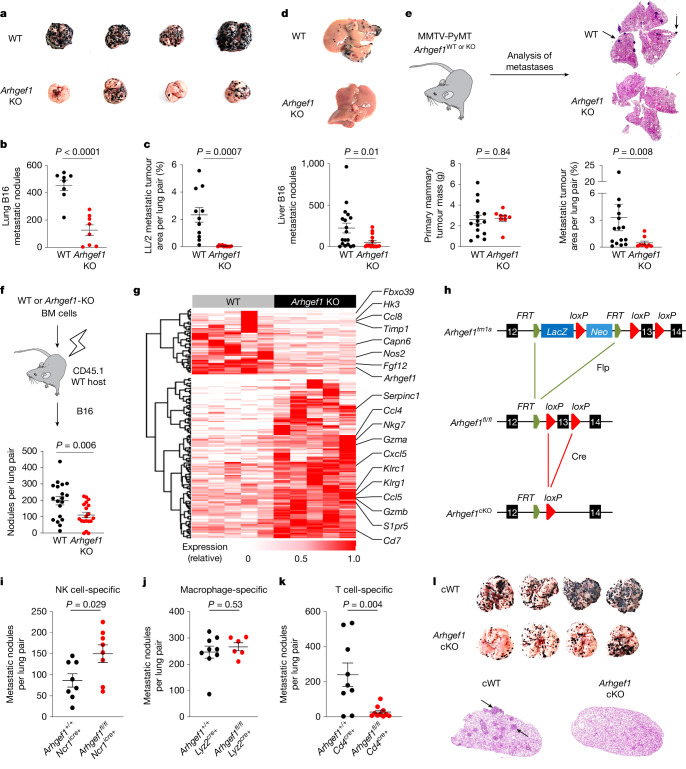
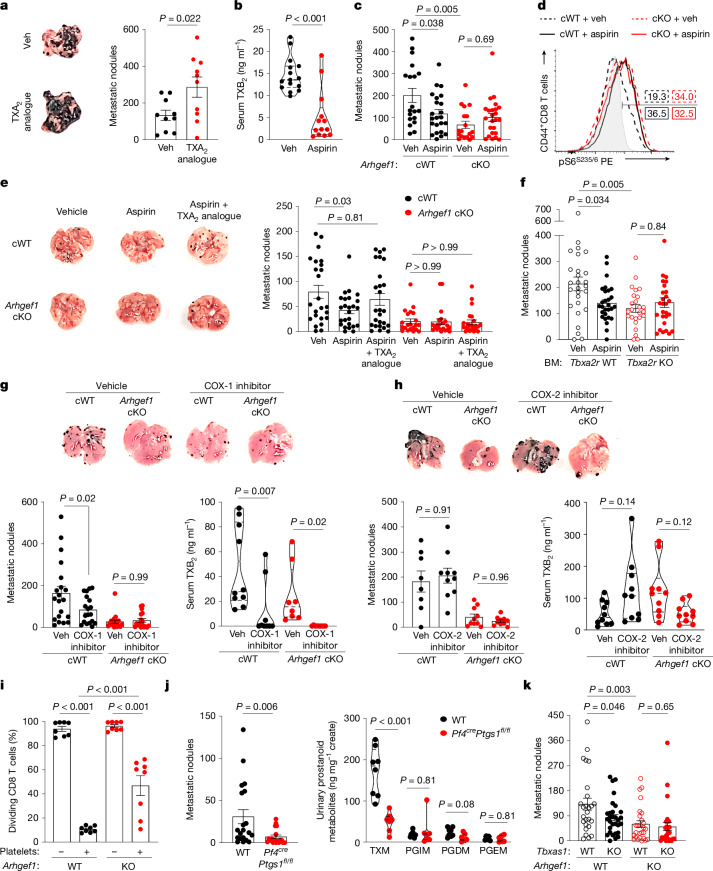
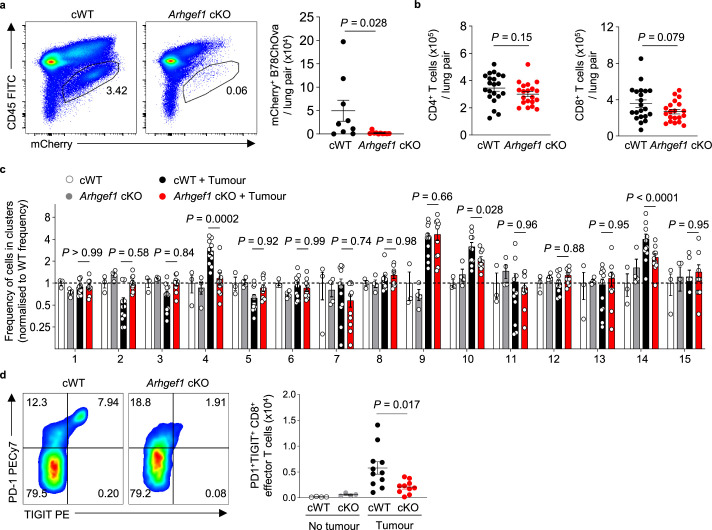
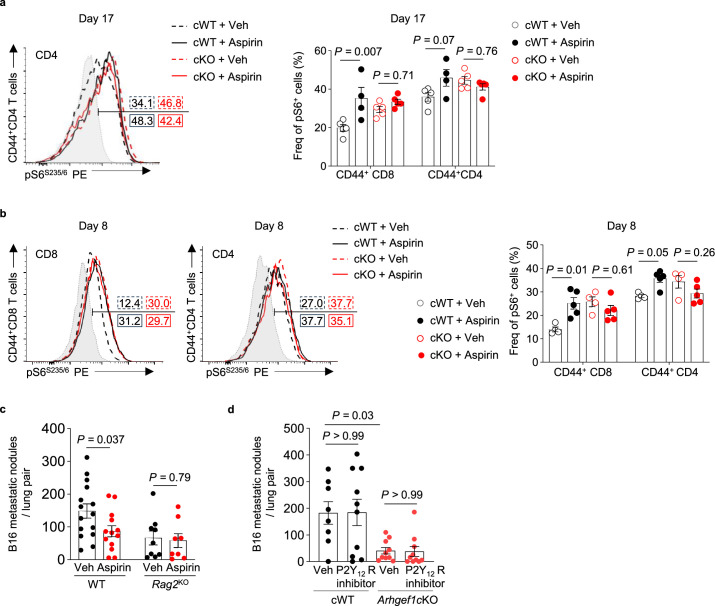
Metastasis is the spread of cancer cells from primary tumours to distant organs and is the cause of 90% of cancer deaths globally1,2. Metastasizing cancer cells are uniquely vulnerable to immune attack, as they are initially deprived of the immunosuppressive microenvironment found within established tumours3. There is interest in therapeutically exploiting this immune vulnerability to prevent recurrence in patients with early cancer at risk of metastasis. Here we show that inhibitors of cyclooxygenase 1 (COX-1), including aspirin, enhance immunity to cancer metastasis by releasing T cells from suppression by platelet-derived thromboxane A2 (TXA2). TXA2 acts on T cells to trigger an immunosuppressive pathway that is dependent on the guanine exchange factor ARHGEF1, suppressing T cell receptor-driven kinase signalling, proliferation and effector functions. T cell-specific conditional deletion of Arhgef1 in mice increases T cell activation at the metastatic site, provoking immune-mediated rejection of lung and liver metastases. Consequently, restricting the availability of TXA2 using aspirin, selective COX-1 inhibitors or platelet-specific deletion of COX-1 reduces the rate of metastasis in a manner that is dependent on T cell-intrinsic expression of ARHGEF1 and signalling by TXA2 in vivo. These findings reveal a novel immunosuppressive pathway that limits T cell immunity to cancer metastasis, providing mechanistic insights into the anti-metastatic activity of aspirin and paving the way for more effective anti-metastatic immunotherapies.


Conflict of interest statement

Competing interests: R.R. is a scientific advisor for Enhanc3D Genomics and OligoTune Ltd and holds industrially funded collaborations with AstraZeneca PLC and F-Star Therapeutics on topics unrelated to this study. E.L. receives research grants from Bristol Meyers Squibb on a topic unrelated to this study and served as a consultant for BD Biosciences. The remaining authors declare no competing interests.

Figures

Fig. 1
Fig. 1. ARHGEF1 suppresses T cell immunity to cancer metastasis.
a,b, Photographs (a) and frequency (b) of lung metastases from wild-type (WT; n = 8) and Arhgef1-knockout (KO; n = 8) littermates after intravenous injection of B16 melanoma cells. c, Quantification of lung metastases relative to total lung area from wild-type (n = 11) and Arhgef1-KO (n = 10) littermates after intravenous injection of LL/2 carcinoma cells. d, Photographs (top) and frequency (bottom) of liver metastases from wild-type (n = 18) and Arhgef1-KO (n = 16) littermates after intrasplenic injection of B16 cells. e, Schema (top left) showing generation of Arhgef1-wild-type or Arhgef1-KO MMTV-PyMT mice. Quantification of primary mammary tumour mass (bottom left), haematoxylin and eosin (H&E) staining of lung sections (top right) and lung metastases relative to total lung area (bottom right) in Arhgef1-wild-type (n = 15) and Arhgef1-KO (n = 9) MMTV-PyMT mice. Arrows show lung metastases. f, Schema (top) and frequency of metastases (bottom) after intravenous injection of B16 cells into bone marrow (BM) chimeras reconstituted with wild-type (n = 19) and Arhgef1-KO (n = 19) bone marrow cells. g, Heat map showing differentially expressed genes (q < 0.05; fold change (|FC|) > 2) between whole tumour-bearing lungs of wild-type (n = 5) and Arhgef1-KO (n = 5) littermates at day 7 after intravenous tumour injection. h, Generation of Arhgef1 conditional-knockout (cKO) allele. ik, Frequency of lung metastases in mice of indicated genotypes: Ncr1icre+ and Ncr1icre+ Arhgef1fl/fl (i; n = 8); Lyz2cre+ (n = 9) and Lyz2cre+ Arhgef1fl/fl (n = 6) (j); and Cd4cre (n = 9) and Cd4cre Arhgef1fl/fl (n = 10) (k), after intravenous injection of B16 cells. l, Photographs (top) and H&E staining (bottom) of Cd4cre (cWT) and Cd4cre Arhgef1fl/fl (Arhgef1-cKO) mice from k. Data are representative of five (b,k) or two (c,i,j) independent experiments, or pooled from three (e) or two (d,f) independent experiments. Unpaired two-tailed Student’s t-test (b,c,f,ik); Two-tailed Mann–Whitney U-test (d,e). Data are mean ± s.e.m. Source data
Fig. 2
Fig. 2. Loss of ARHGEF1 promotes CD8+ T cells with enhanced cytokine polyfunctionality.
ac, Representative flow cytometry plots of TNF, IL-2 and IFNγ expression (a) and frequency of cells expressing TNF, IL-2 and IFNγ, presented in terms of cytokine polyfunctionality (b) and relative frequency (c), following intracellular cytokine staining of CD8+ T cells from lungs of Cd4cre (cWT, n = 11) and Arhgef1fl/fl Cd4cre (Arhgef1 cKO, n = 10) mice 17 days after intravenous injection of B78ChOva melanoma cells. d, Uniform manifold approximation and projection (UMAP) analysis of the phenotype of concatenated CD8+ T cells from lungs of B78ChOva tumour-bearing (cWT, n = 11; Arhgef1 cKO, n = 10) and non-tumour-bearing mice (cWT, n = 3; cKO, n = 4). Colours and numbering depict cell clusters identified by Phenograph. e, Relative expression of indicated markers by CD8+ T cells in d. f, Mean expression of indicated markers by CD8+ T cells in indicated clusters in d. g, Relative frequency of CD8+ T cells in indicated Phenograph clusters in d. h, PD-1 and TIM3 expression on effector CD8+ T cells in tumour-bearing lungs from mice described in d of the indicated genotypes. Representative flow cytometry plots (left) and replicate measurements (right). i,j, Frequency of OVA257–264 tumour antigen-specific CD8+ T cells as detected by peptide–MHC tetramer staining from tumour-bearing lungs (i) of mice in d and representative flow cytometry plots and replicate measurements of PD-1 and TOX expression on OVA257–264 tumour antigen-specific CD8+ T cells (j). Data are representative of two independent experiments. Unpaired two-tailed Student t-tests with Holm–Šídák correction for multiple hypothesis testing (c); two-way analysis of variance (ANOVA) with Tukey multiple comparisons test (g); one-way ANOVA with Tukey multiple comparisons test (h,i); and unpaired two-tailed Student t-tests (j). Data are mean ± s.e.m. Source data
Fig. 3
Fig. 3. TXA2 suppresses activation and proliferation of T cells via ARHGEF1.
a, Identification of Gα12/13-coupled GPCRs expressed by T cells. Left, expression in naive and activated T cells of genes encoding Gα12/13-coupled GPCRs with moderate to high coupling index to Gα12 or Gα13 (log relative intrinsic activity > –1) identified in ref. . Right, known ligands or agonists of expressed receptors. 9-HODE, 9-hydroxyoctadecadienoic acid; LPA, lysophosphatidic acid; LysoPI, lysophosphatidylinositol; LysoPS, lysophosphatidylserine; PGE2, prostaglandin E2b, In vitro ligand screen of identified Gα12/13-coupled GPCRs. Naive FACS-sorted CD8+ T cells were stimulated in vitro with anti-CD3/28 antibodies and recombinant human IL-2 (rhIL-2) in the presence of indicated ligands or agonists. The ratio of activated CD44+ cells among wild-type and Arhgef1-deficient CD8+ T cells was measured at day 5. n = 3–4 independent replicates per condition. S1P, sphingosine 1-phosphate. c, Differentiation state of naive wild-type and Arhgef1-deficient CD8+ T cells stimulated in vitro with anti-CD3/28 antibodies and rhIL-2 in the presence of indicated concentrations of TXA2 analogue U46619. d,e, CellTrace Violet (CTV) proliferation analysis (d) and cell number (e) on day 5 for naive wild-type and Arhgef1-deficient CD8+ T cells stimulated with anti-CD3/28 antibodies and rhIL-2 in the presence or absence of 5μM TXA2 analogue U46619. f, Naive wild-type and Arhgef1-deficient CD8+ T cells were electroporated with nucleoprotein complexes of Cas9 and single guide RNAs (sgRNAs) targeting Tbxa2r or scrambled sgRNA control (Ctrl) and stimulated with anti-CD3/28 antibodies and rhIL-2 in the presence or absence of 5 μM TXA2 analogue U46619. n = 5 independent replicates per condition. g, Photomicrographs of cells 5 days after stimulation of naive CD8+ T cells with anti-CD3/28 antibodies and rhIL-2 in the presence of TXA2 analogue U46619 or vehicle control, and treatment with the TXA2 receptor inhibitor (SQ 29548, 10 μM). Data are representative of two (b,f,g) or three (ce) independent experiments. Two-tailed Student t-tests with Bonferroni–Dunn (b) and Holm–Šídák (c,e,f) correction for multiple hypothesis testing. Data are mean ± s.e.m. Source data
Fig. 4
Fig. 4. Thromboxane signalling suppresses TCR-driven T cell and kinase pathway activation via TP, ARHGEF1 and RHOA.
a, Heat map showing differentially expressed genes 5 days after stimulation of naive CD8+ T cells with anti-CD3/28 antibodies and rhIL-2 in the presence of TXA2 analogue or vehicle (q < 0.05; |FC| > 1.5). b, Enrichment analysis of indicated gene set in global transcriptional differences between TXA2-treated Arhgef1-KO versus wild-type CD8+ T cells. NES, normalized enrichment score. c, S6 and ERK phosphorylation in splenic CD8+ T cells stimulated ex vivo with crosslinked anti-CD3 antibodies and TXA2 analogue or vehicle (5 min). d, Quantity of GTP-bound (active) and total RHOA from wild-type or Arhgef1-deficient OT-1 CD8+ T cells stimulated with TXA2 analogue or vehicle (5 min). e, Complementation of Arhgef1-deficient OT-1 CD8+ T cells with RHOACA using retroviral expression. S6 and ERK phosphorylation was measured in THY1.1+ (transduced) cells after stimulation with crosslinked anti-CD3 antibodies. f, Confocal imaging (left) and computational analysis (right) of PTEN, F-actin and DAPI localization in wild-type and Arhgef1-deficient OT-1 CD8+ T cells stimulated with TXA2 analogue after pre-treatment with ROCK inhibitor (Y-27632, 30 μM), TXA2 receptor inhibitor (SQ 29548, 10 μM) or vehicle. Arrows show PTEN and F-actin colocalization. n = 2 independent replicates per condition. One-way ANOVA with Tukey multiple comparisons test. Scale bars, 20 μm. MFI, mean fluorescence intensity. g, AKT and ERK phosphorylation in wild-type and Arhgef1-deficient OT-1 CD8+ T cells stimulated with TXA2 analogue and crosslinked anti-CD3 antibodies following inhibitor pre-treatment as in f. h, Ex vivo S6 phosphorylation in splenic naive CD8+ T cells after anti-CD3 antibody crosslinking (5 min) after AKT inhibitor VIII (AKTi, 1 μM) or vehicle pre-treatment. NS, no stimulation. i, TNF expression by splenic naive CD8+ T cells 5 h after stimulation in the presence of 1 μM AKTi or vehicle. Data are representative of three (c,d) and two (ei) independent experiments. Data are mean ± s.e.m. Source data
Fig. 5
Fig. 5. Aspirin promotes anti-metastatic immunity by releasing T cells from ARHGEF1-dependent suppression by TXA2.
a, Photographs (left) and frequency (right) of lung metastases in mice treated with TXA2 analogue (n = 10) or vehicle (veh; n = 10) 17 days after intravenous injection of B16 cells. b, Serum TXB2 abundance in vehicle (n = 15) or aspirin-treated (n = 13) B16-bearing mice. c, Frequency of B16 lung metastases in Cd4cre (cWT) and Arhgef1fl/fl Cd4cre (cKO) mice treated with vehicle (cWT, n = 19; cKO, n = 18) or aspirin (cWT, n = 23; cKO, n = 24). d, Ex vivo S6 phosphorylation among CD44+ CD8+ T cells in lungs of vehicle- or aspirin-treated cWT and Arhgef1 cKO mice 17 days after intravenous injection of B16 cells. Grey, non-crosslinking control. Numbers show percentages within indicated gate. e, Frequency of B16 lung metastases in mice of indicated genotype treated with vehicle (cWT, n = 24; cKO, n = 21), aspirin (cWT, n = 25; cKO, n = 21), or aspirin and TXA2 analogue (cWT, n = 26; cKO, n = 23). f, Frequency of B16 lung metastases in bone marrow chimeras reconstituted with wild-type or Tbxa2r-KO bone marrow cells and treated with vehicle (wild type, n = 27; KO, n = 25) or aspirin (wild type, n = 28; KO, n = 28). g,h, Frequency of B16 lung metastases and serum TXB2 abundance in cWT or cKO mice treated with COX-1 inhibitor SC-560 (cWT, n = 19; cKO, n = 17) or vehicle (cWT, n = 20; cKO, n = 19) (g), and COX-2 inhibitor celecoxib (cWT, n = 10; cKO, n = 10) or vehicle (cWT, n = 8; cKO, n = 10) (h). i, Proliferation of wild-type and Arhgef1-deficient naive CD8+ T cells in contact-independent co-culture with platelets. j, Frequency of lung B16 metastases (left; wild type, n = 20; Pf4cre Ptgs1fl/fl, n = 18) and mass spectrometry of urinary prostanoids (right) in mice of indicated genotypes. PGDM, 11,15-dioxo-9α-hydroxy-2,3,4,5-tetranorprostan-1,20-dioic acid; PGEM, 7-hydroxy-5,11-diketotetranorprostane-1,16-dioic acid; PGIM, 2,3-dinor-6-keto-PGF; TXM, 2,3-dinor-TXB2. k, Frequency of B16 lung metastases in wild-type (n = 26), Tbxas1-KO (n = 30), Arhgef1-KO (n = 27) and Tbxas1-KO Arhgef1-KO (n = 28) mice. Data are representative of two (a,b) or pooled from two (ej) or three (c,k) independent experiments. Unpaired two-tailed Student’s t-test (a); one-way ANOVA with Tukey (c,e,fi) and Holm–Šídák (k) adjustment; two-tailed Mann–Whitney U-test (b,j). Data are mean ± s.e.m. Source data
Extended Data Fig. 1
Extended Data Fig. 1. Reduced cancer metastasis in animals lacking ARHGEF1.
a, Representative flow cytometry plots (left) and number (right) of mCherry+ CD45 tumour cells in lungs of WT and Arhgef1 KO littermates 17 days after intravenous (i.v.) injection of B78ChOva-mCherry cells. b, Representative photomicrographs of haematoxylin and eosin (H&E) stains of lung sections from wildtype and Arhgef1-deficient animals 17 days after intravenous injection of syngeneic LL/2 lung adenocarcinoma cells. Arrows indicate metastatic deposits. c, Representative photomicrographs of H&E stains of liver sections from wildtype and Arhgef1-deficient animals 11 days after intrasplenic injection of syngeneic B16-F10 melanoma cells. Arrows indicate metastatic deposits. d, Cumulative area of primary mammary tumours arising in Arhgef1-WT (n = 15) and -KO (n = 9) MMTV-PyMT female littermate mice at the indicated ages (left) and survival time to cumulative area of 2.25 cm2, at which time point lungs were harvested for histopathology analysis. Log-rank test; P = 0.31. e, Area of tumours of WT (n = 7) and Arhgef1 KO (n = 5) littermates was measured at the indicated time points following subcutaneous implantation of MC38 colorectal adenocarcinoma cells. Data are representative of five (a) and two (e) independent experiments or pooled from three (d) independent experiments. Unpaired two-tailed Student’s t test (a). Graphs show mean ± s.e.m. Source data
Extended Data Fig. 2
Extended Data Fig. 2. Analysis of haematopoietic lineages within tumour-bearing lungs of WT and Arhgef1-deficient animals.
Frequency of mature haematopoietic lineages within tumour-bearing lungs of WT (n = 9) and Arhgef1 KO (n = 9) littermates 16 days after intravenous injection of B16 cells. Data are pooled from two independent experiments. Unpaired two-tailed Student’s t test. Graphs show mean ± s.e.m. Source data
Extended Data Fig. 3
Extended Data Fig. 3. Immune responses in tumour-bearing lungs of animals bearing a conditional deletion of ARHGEF1 in T cells.
a, Flow cytometry plots (left) and replicate measurements (right) of the number of mCherry+ CD45 tumour cells in lungs of Cd4Cre (cWT = 9) and Arhgef1fl/fl Cd4Cre (cKO =10) animals 17 days after intravenous (i.v.) injection of B78ChOva cells. b, Quantification of CD4+ (left) and CD8+ (right) T cells from tumour-bearing lungs of cWT (n = 21) and cKO (n = 20) mice 17 days after i.v. injection of tumour cells. c, Relative frequency of CD8+ T cells within all 15 phenograph clusters (data for clusters 4, 9, 10 and 14 also shown in Fig. 2g, as noted in Source Data) from lungs of B78ChOva tumour-bearing and non-tumour-bearing mice of the indicated genotypes (tumour-bearing cWT, n = 11; tumour-bearing Arhgef1 cKO, n = 10; cWT, n = 3; cKO, n = 4). d, PD-1 and TIGIT expression on effector CD8+ T cells within tumour-bearing lungs of animals in (c) of the indicated genotypes. Representative flow cytometry plots (left) and replicate measurements (right). Data are representative of five (a) and two (c, d) independent experiments or pooled from three (b) independent experiments. Unpaired two-tailed Student’s t test (b); 2-way ANOVA with Tukey multiple comparisons test (c); One-way ANOVA with Tukey multiple comparisons test (d) and two-tailed Mann-Whitney U test (a). Graphs show mean ± s.e.m. Source data
Extended Data Fig. 4
Extended Data Fig. 4. Characterisation of T cell responses and metastasis load in Arhgef1-deficient animals.
a, PD-1, TIM-3 and TIGIT expression on effector CD4+ T cells within tumour-bearing lungs of Cd4Cre (cWT) and Arhgef1fl/fl Cd4Cre (Arhgef1 cKO) animals. Flow cytometry plots (left) show CD4+ T cells from tumour-bearing lungs, and graphs show replicate measurements from tumour-bearing (cWT = 11; Arhgef1 cKO = 10) and non-bearing (cWT = 4; Arhgef1 cKO = 4) animals (right). b, Intracellular cytokine staining of OVA257-264-specific CD8+ T cells from tumor-bearing lungs of Cd4Cre (cWT = 11) and Arhgef1fl/fl Cd4Cre (Arhgef1 cKO = 10) animals 17 days after intravenous (i.v.) injection of B78ChOva melanoma cells. Flow cytometry plots of TNF, IL-2 and IFN-γ expression (left) and frequency of cells expressing indicated cytokines upon brief stimulation ex vivo, presented in terms of cytokine polyfunctionality (right). c, Kinetic analysis of mCherry+ CD45 melanoma cells within lungs from WT (n = 6-8) and Arhgef1 KO mice (n = 4-8) at the indicated time points after i.v. injection of B78ChOva cells. d, Relationship between tumour burden and PD-1 expression by CD44+ CD8+ T cells of lungs of Cd4Cre (cWT = 17) and Arhgef1fl/fl Cd4Cre (Arhgef1 cKO = 18) animals 17 days after i.v. injection of tumour cells. Data are representative of two (a-c) or pooled from two (d) independent experiments. One-way ANOVA with Tukey multiple comparisons test (a); unpaired two-tailed Student t tests with Holm-Šídák correction for multiple hypothesis testing (b, c) and Simple Linear Regression (d). Graphs show mean ± s.e.m. Source data
Extended Data Fig. 5
Extended Data Fig. 5. Loss of ARHGEF1 within T cells promotes memory-like CD8+ T cell responses following attenuated Listeria monocytogenes (LM)-Ova infection.
a, Experimental schema showing timeline of Cd4Cre (cWT) and Arhgef1fl/fl Cd4Cre (Arhgef1 cKO) littermates following attenuated LM-Ova infection. b, c, Representative flow cytometry plots (b) and frequency (c) of tetramer+ CD8+ T cells and its subsets in blood samples of Cd4Cre (cWT, n = 5-9) and Arhgef1fl/fl Cd4Cre (Arhgef1 cKO, n = 5-10) littermates at indicated time points following attenuated LM-Ova infection. MPEC, memory precursor effector cells; SLEC, short-lived effector cells; Data are pooled from two independent experiments. Multiple unpaired two-tailed Student’s t-test with Holm-Šídák correction (c). Graphs show mean ± s.e.m. Source data
Extended Data Fig. 6
Extended Data Fig. 6. In vitro ligand screen of identified Ga12/13-coupled GPCRs in ARHGEF1-deficient T cells.
Naïve FACS-sorted CD8+ T cells were stimulated in vitro with anti-CD3/28 antibodies and rhIL-2 in the presence of indicated ligands and photomicrographs of cell culture at day 5 post-stimulation for indicated genotypes were shown. Data are representative of two independent experiments.
Extended Data Fig. 7
Extended Data Fig. 7. TXA2 signaling regulates CD8+ T cell differentiation and proliferation in an ARHGEF1-dependent manner in vitro.
a-c, Naïve FACS-sorted CD8+ T cells were stimulated in vitro with anti-CD3/28 antibodies and rhIL-2 in the presence of TXA2 analogue or vehicle control. The differentiation state based on surface marker expression (a), proliferation measured by CellTrace Violet (CTV) (b), and apoptosis measured by Annexin V and Propidium Iodide (c) of WT and Arhgef1 KO CD8+ T cells at indicated time points post-stimulation were assessed by flow cytometry. n = 3 independent replicates per condition. Data are representative of two independent experiments. Multiple unpaired two-tailed Student’s t-test with Holm-Šídák correction (b, c). Graphs show mean ± s.e.m. Source data
Extended Data Fig. 8
Extended Data Fig. 8. The TXA2 receptor TP regulates CD8+ T cells in an ARHGEF1-dependent manner.
a-b, Proliferation WT and Arhgef1-deficient naïve CD8+ T cells electroporated with nucleoprotein complexes of Cas9 and 3 different sgRNAs targeting Tbxa2r or scrambled sgRNA control and stimulated in vitro with anti-CD3/28 antibodies and rhIL-2 in the presence or absence of 5 μM TXA2 analogue U46619. Proliferation is assessed as dilution of the CellTrace Violet. n = 5 independent replicates per condition. c, Confirmation of Tbxa2r deletion using SDS-PAGE and Western blotting of cell lysates from cells in (a, b). d, Number of cells 5 days after stimulation of naïve FACS-sorted CD8+ T cells with anti-CD3/28 antibodies and rhIL-2 in the presence of TXA2 analogue U46619 or vehicle control and the treatment with TP inhibitor SQ 29548 (10 μM). n = 4 independent replicates per condition. Data are representative of two independent experiments (a-d). Multiple two-tailed Student’s t-test with Holm-Šídák correction (b) and 2-way ANOVA with Tukey multiple comparisons test (d). Graphs show mean ± s.e.m. Source data
Extended Data Fig. 9
Extended Data Fig. 9. Thromboxane A2 suppresses activation transcriptional programs in T cells via ARHGEF1.
Heatmap showing single-sample Gene Set Enrichment Analysis (ssGSEA) of the global gene expression changes between TXA2 analogue and Vehicle-treated-WT and Arhgef1 KO CD8+ T cells. Enrichment of all gene sets comprising the MSigDB C7 Immunologic signature gene sets was tested. Significantly differentially enriched gene sets shown (FDR < 0.2, |FC| > 1.5). Data are show results from three to four biological replicates per group.
Extended Data Fig. 10
Extended Data Fig. 10. ARHGEF1 suppresses TCR-driven kinase signaling in T cells via RhoA.
a, Replicate measurements of S6 and ERK phosphorylation within splenic WT (n = 3) and Arhgef1-deficient (n = 3) CD8+ T cells stimulated ex vivo with crosslinked anti-CD3 antibodies for 5 min in the presence of TXA2 analogue or vehicle control. b, Immunoblot analysis of MEK, ERK, AKT and S6 phosphorylation in day 5 stimulated WT or Arhgef1 KO OT-1 TCR transgenic CD8+ T cells stimulated in vitro with crosslinked anti-CD3 antibodies for 5 min in the presence of TXA2 analogue or vehicle control. c, Representative flow cytometry plots of increased phosphorylation of AKT, S6 and ERK following PMA/Iono stimulation of WT and Arhgef1 KO cells ex vivo. Gated on CD44 naïve CD8+ T cells. NS, no stimulation. d, Experimental schema of ablation of Rhoa using CRISPR/Cas9 mutagenesis. e, Cas9-expressing OT-1 TCR transgenic CD8+ T cells were stimulated and transduced with retroviruses expressing sgRNAs targeting Rhoa or non-targeting (NT) control. Cells were stimulated with crosslinked anti-CD3 antibodies for 5 min and S6 and ERK phosphorylation was measured on Thy1.1+ (transduced) cells. n = 4 independent replicates per condition. Data are representative of two independent experiments (a-e). Multiple two-tailed Student’s t-test with Holm-Šídák correction (a, e). Graphs show mean ± s.e.m. Source data
Extended Data Fig. 11
Extended Data Fig. 11. Thromboxane A2 induces PTEN recruitment and suppresses AKT phosphorylation in T cells via ROCK kinase.
a, Confocal immunofluorescence imaging of WT and Arhgef1-KO OT-1 CD8 T-cells 5 days after primary stimulation and subsequently seeded on anti-CD3 antibody-coated coverslips with or without 10 min of stimulation with U-46619 (10 μM) and/or 1 h of preincubation with the TP inhibitor (SQ 29548, 10 μM) or ROCK inhibitor (Y-27632, 30 μM). Images were captured on a Leica confocal microscope using a 63x oil objective lens, in three channels, F-actin (yellow) and PTEN (red) plus a DAPI nuclear counter stain (blue) to locate the cells. Images analysed were maximum intensity projections of four consecutive z-slices selected from the centre of a cross-volume image stack. b, Immunoblot analysis of protein phosphorylation pre-activated (day 5) WT or Arhgef1 KO OT-1 TCR transgenic CD8+ T cells stimulated in vitro with crosslinked anti-CD3 antibodies for 5 min in the presence of TXA2 analogue or vehicle control and treatments with the PTEN inhibitor (bpV(pic), 2.5 μM) or ROCK inhibitor (GSK269962A, 10 μM). Data are representative of two independent experiments.
Extended Data Fig. 12
Extended Data Fig. 12. Aspirin treatment increases the signaling capacity of T cells within tumour-bearing lungs of WT but not Arhgef1 conditional knockout animals.
a-b, Phosflow analysis of S6 phosphorylation gated on antigen-experienced (CD44+) CD4+ and CD8+ T cells from lungs of vehicle- or aspirin-treated Cd4Cre and Arhgef1fl/fl Cd4Cre mice 17 days (a) and 8 days (b) after i.v. injection of B16 cells upon 5 min stimulation ex vivo with crosslinked anti-CD3 antibodies. Grey, non-crosslinking control. cWT treated with vehicle (n = 5) and aspirin (n = 4); cKO treated with vehicle (n = 5) and aspirin (n = 5) in (a). cWT treated with vehicle (n = 4) and aspirin (n = 5); cKO treated with vehicle (n = 4) and aspirin (n = 5) in (b). c, Frequency of metastatic nodules on lungs of vehicle- or aspirin-treated WT and Rag2-deficient (KO) mice 17 days after i.v. injection of B16 cells (NK cell activation in Rag2-deficient animals results in reduced background rate of metastasis). WT treated with vehicle (n = 15) and aspirin (n = 13); Rag2 KO treated with vehicle (n = 9) and aspirin (n = 8). d, Effect of treatment with the P2Y12 inhibitor Ticagrelor on the rate of metastasis to the lungs of Cd4Cre (cWT, vehicle = 8 and Ticagrelor = 10) and Arhgef1fl/fl Cd4Cre (cKO, vehicle = 10 and Ticagrelor = 10) mice 17 days after i.v. injection of B16 cells. Data from vehicle-treated cWT and cKO groups were also used as controls in Fig. 5h (as noted in Source Data). Data are representative of two (a-c) or pooled from two (d) independent experiments. P values show the results of unpaired two-tailed Student’s t test (c); One-way ANOVA with Tukey multiple comparisons adjustment (a, b, d). Graphs show mean ± s.e.m. Source data
Extended Data Fig. 13
Extended Data Fig. 13. Platelet-mediated suppression of T cells and anti-metastatic immunity.
a, Schema showing isolation of platelets and transwell co-culture with proliferation dye CellTrace Violet (CTV)-labelled naïve CD8+ T cells. Transwell plates were pre-coated with anti-CD3 and soluble anti-CD28 antibodies to stimulate CD8+ T cells. b, Flow cytometry plots showing proliferation and activation of naïve and Arhgef1-decifient T cells in (a) as determined by dilution of CTV dye and expression of CD44. c, Abundance of TXB2 as determined by enzyme-linked immunosorbent assay (ELISA) of transwell co-culture supernatants of cells in (b) at day 5 post-stimulation. n = 4 independent replicates per condition. d, Effect of platelet depletion on the frequency of metastases on lungs of Cd4Cre (cWT, vehicle = 18 and R300 = 19) and Arhgef1fl/fl Cd4Cre (cKO, vehicle = 18 and R300 = 20) mice 17 days after i.v. B16 injection. e, Frequencies of platelets in blood as determined by flow cytometry from animals in (d). cWT treated with vehicle (n = 5) and R300 (n = 6), and cKO treated with R300 (n = 8). Data are representative of two (b, c, e) or pooled from two (d) independent experiments. One-way ANOVA with Tukey multiple comparisons test. Graphs show mean ± s.e.m. Source data
Extended Data Fig. 14
Extended Data Fig. 14. Aspirin promotes immunity to cancer metastasis by releasing T cells from ARHGEF1-dependent suppression by TXA2.
Graphical schema of study findings. Platelets produce TXA2 which binds to its receptor (TP) on T cells, triggering the activation of ARHGEF1, a guanine exchange factor which facilitates the conversion of inactive GDP-bound RhoA into its active GTP-bound conformation. Activation of RhoA inhibits TCR-driven kinase pathways, proliferation and effector functions of T cells, thereby suppressing anti-metastatic immunity. Production of TXA2 by platelets is COX1-dependent and inhibited by aspirin and COX-1 selective inhibitors, which release T cells from TXA2-mediated suppression. Created in BioRender. Roychoudhuri, R. (2025) https://BioRender.com/u42p292.

References

    1. Valastyan, S. & Weinberg, R. A. Tumor metastasis: molecular insights and evolving paradigms. Cell147, 275–292 (2011). - PMC - PubMed
    1. Sung, H. et al. Global Cancer Statistics 2020: GLOBOCAN estimates of incidence and mortality worldwide for 36 cancers in 185 countries. CA Cancer J. Clin. 71, 209–249 (2021). - PubMed
    1. Massagué, J. & Obenauf, A. C. Metastatic colonization by circulating tumour cells. Nature529, 298–306 (2016). - PMC - PubMed
    1. Sosa, M. S., Bragado, P. & Aguirre-Ghiso, J. A. Mechanisms of disseminated cancer cell dormancy: an awakening field. Nat. Rev. Cancer14, 611–622 (2014). - PMC - PubMed
    1. Patrono, C., García Rodríguez, L. A., Landolfi, R. & Baigent, C. Low-dose aspirin for the prevention of atherothrombosis. N. Engl. J. Med.353, 2373–2383 (2005). - PubMed

MeSH terms

LinkOut - more resources