. 2025 Apr;640(8057):135-145.
doi: 10.1038/s41586-025-08619-6. Epub 2025 Mar 5.

Solanum pan-genetics reveals paralogues as contingencies in crop engineering

Affiliations

Solanum pan-genetics reveals paralogues as contingencies in crop engineering

Matthias Benoit et al. Nature. 2025 Apr.

Abstract

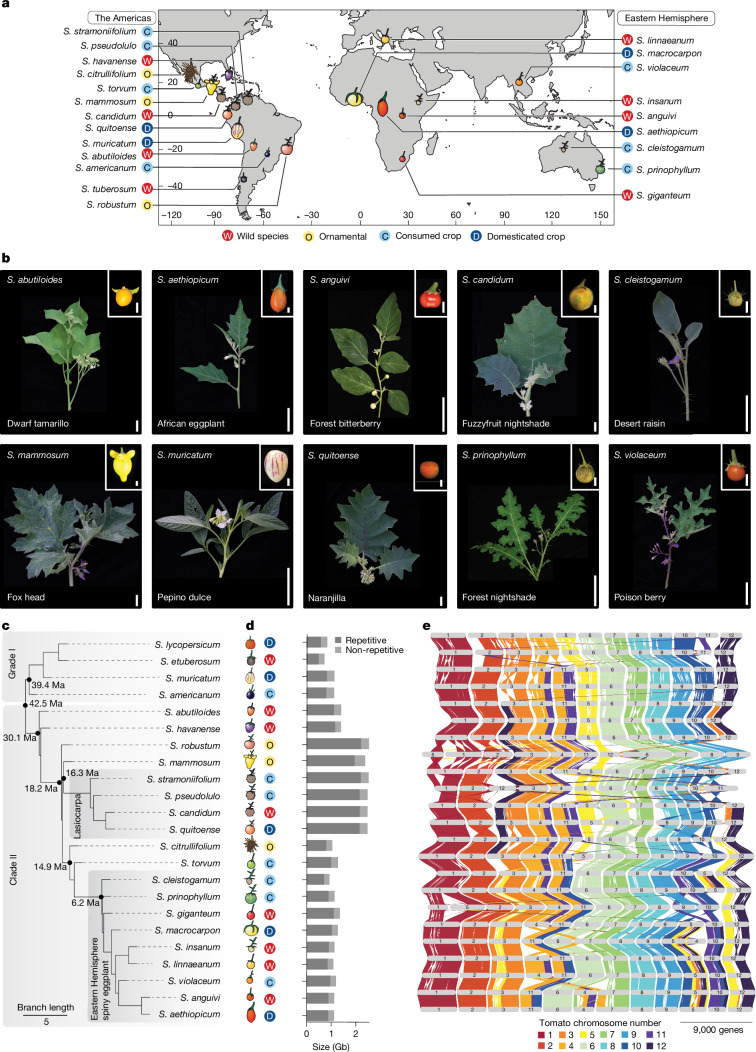
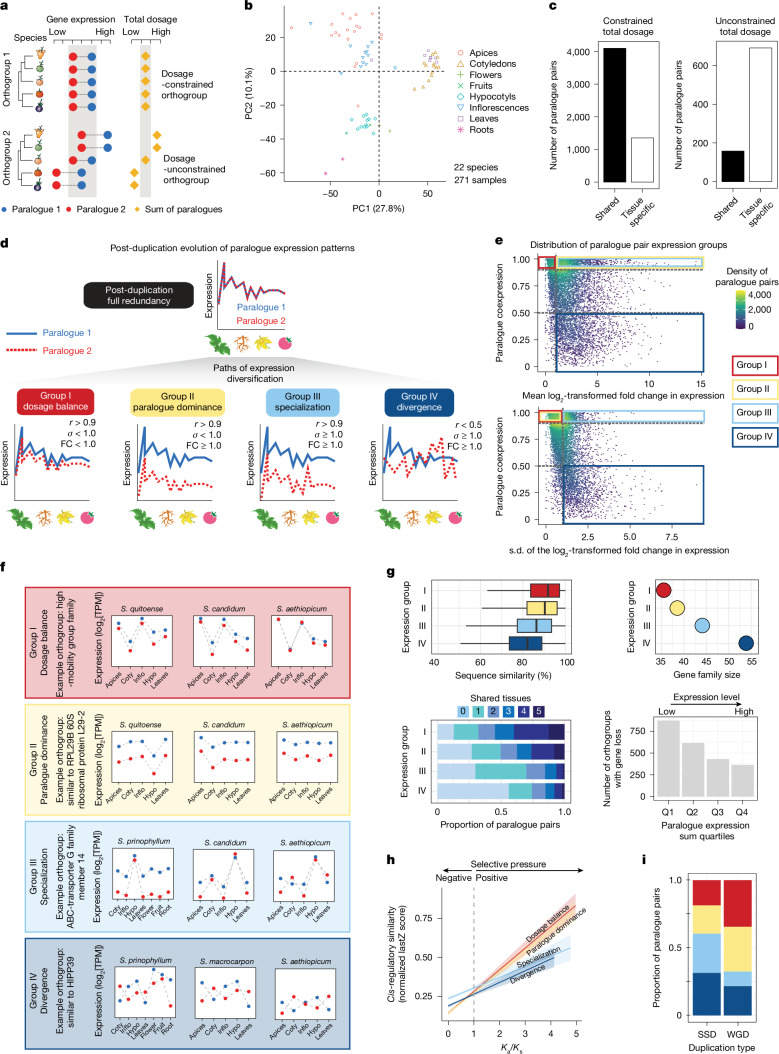
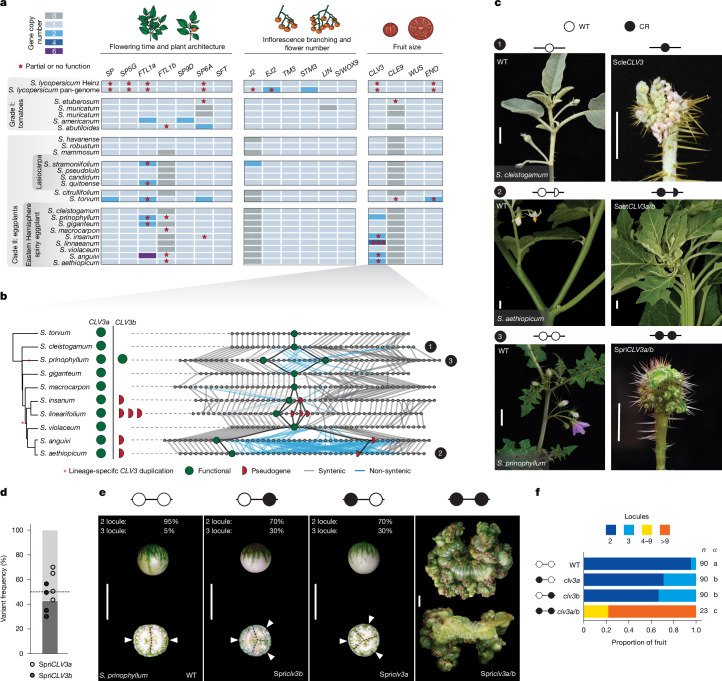
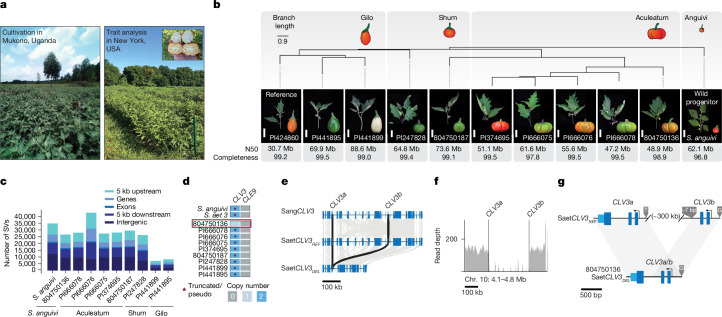
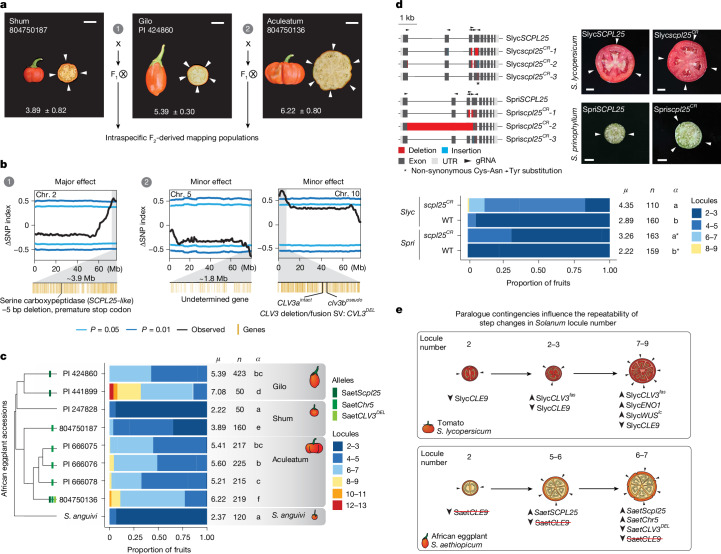
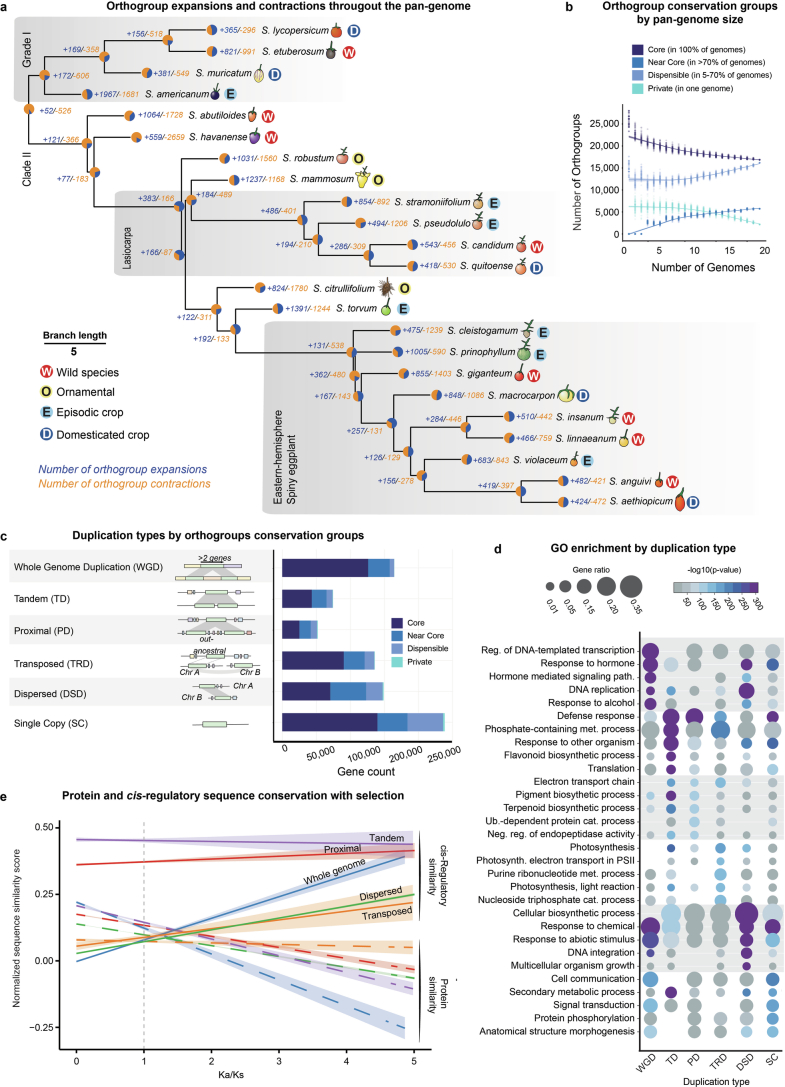
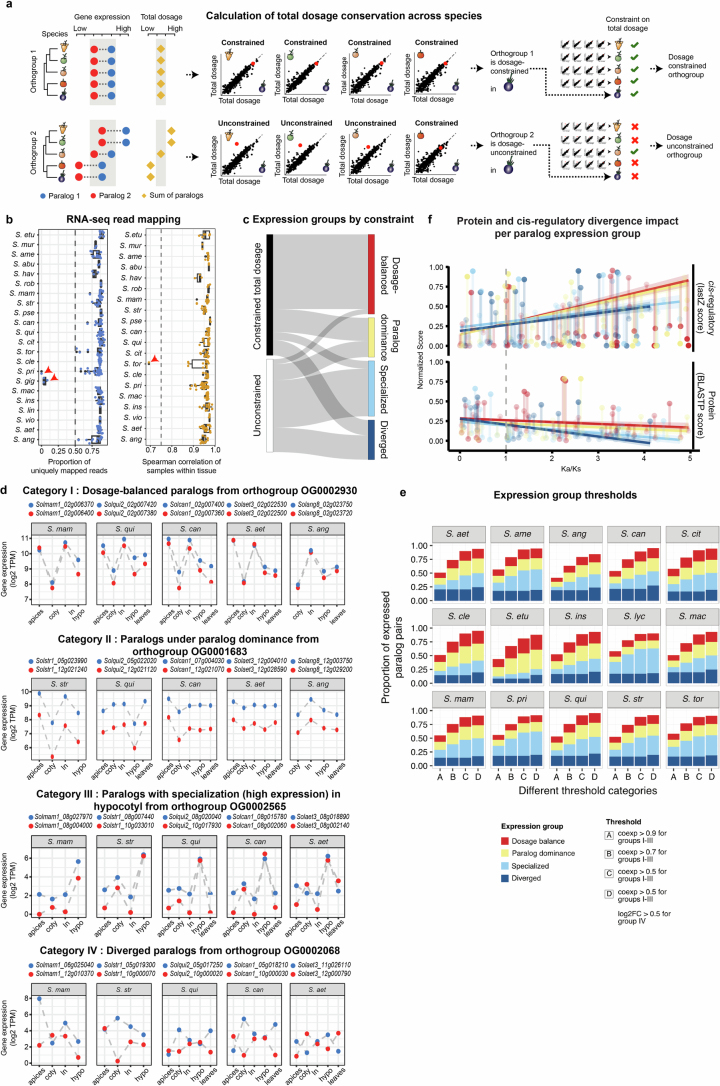
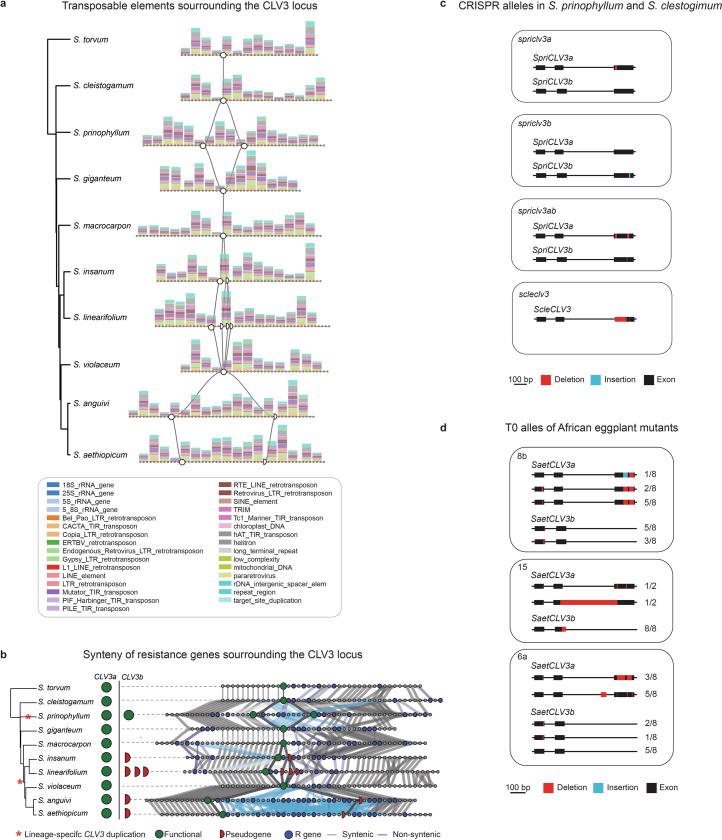
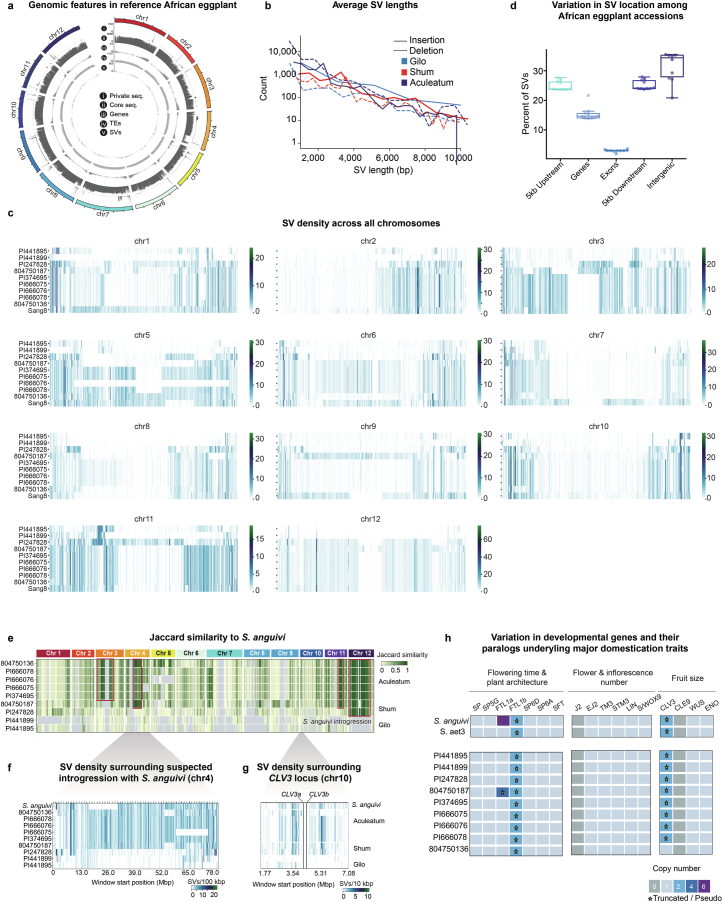
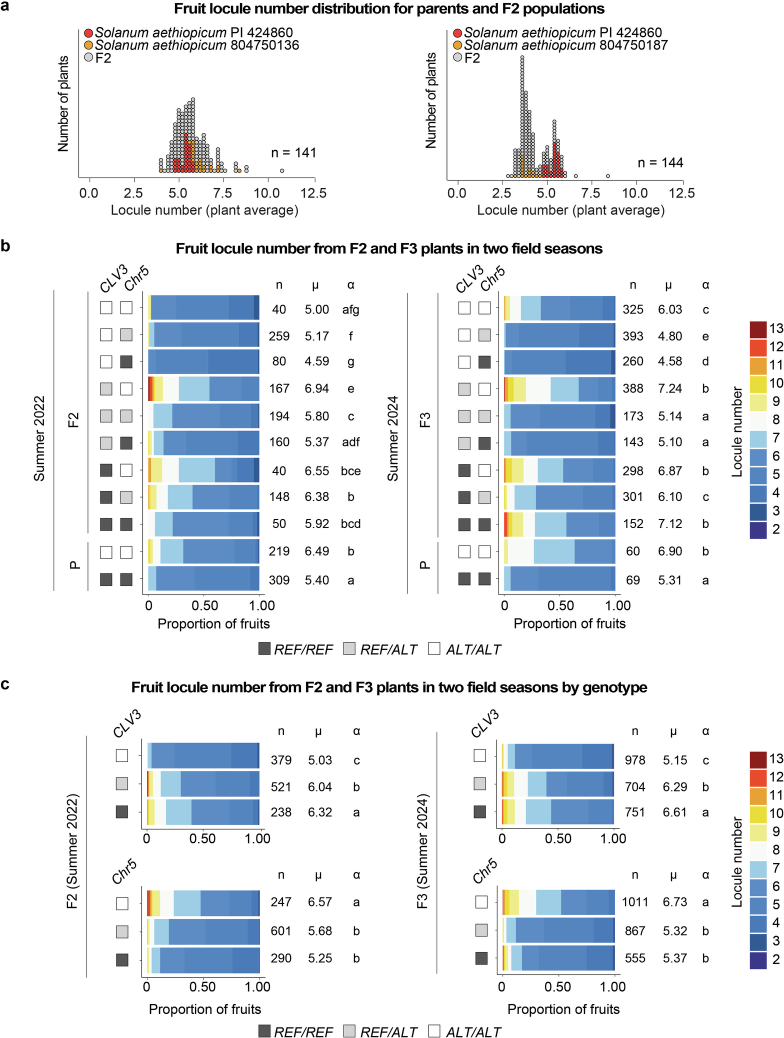
Pan-genomics and genome-editing technologies are revolutionizing breeding of global crops1,2. A transformative opportunity lies in exchanging genotype-to-phenotype knowledge between major crops (that is, those cultivated globally) and indigenous crops (that is, those locally cultivated within a circumscribed area)3-5 to enhance our food system. However, species-specific genetic variants and their interactions with desirable natural or engineered mutations pose barriers to achieving predictable phenotypic effects, even between related crops6,7. Here, by establishing a pan-genome of the crop-rich genus Solanum8 and integrating functional genomics and pan-genetics, we show that gene duplication and subsequent paralogue diversification are major obstacles to genotype-to-phenotype predictability. Despite broad conservation of gene macrosynteny among chromosome-scale references for 22 species, including 13 indigenous crops, thousands of gene duplications, particularly within key domestication gene families, exhibited dynamic trajectories in sequence, expression and function. By augmenting our pan-genome with African eggplant cultivars9 and applying quantitative genetics and genome editing, we dissected an intricate history of paralogue evolution affecting fruit size. The loss of a redundant paralogue of the classical fruit size regulator CLAVATA3 (CLV3)10,11 was compensated by a lineage-specific tandem duplication. Subsequent pseudogenization of the derived copy, followed by a large cultivar-specific deletion, created a single fused CLV3 allele that modulates fruit organ number alongside an enzymatic gene controlling the same trait. Our findings demonstrate that paralogue diversifications over short timescales are underexplored contingencies in trait evolvability. Exposing and navigating these contingencies is crucial for translating genotype-to-phenotype relationships across species.


Conflict of interest statement

Competing interests: W.R.M. is a founder and shareholder in Orion Genomics, a plant genomics company. Z.B.L. is a consultant for and a member of the Scientific Strategy Board of Inari Agriculture. The other authors declare no competing interests.

Figures

Fig. 1
Fig. 1. The Solanum pan-genome captures the phenotypic, ecological, agricultural and genomic diversity of this crop-rich genus.
a, Approximate centroid of the native range for the 22 selected Solanum species, grouped by type of agricultural use: wild (W), locally important and consumed (C), ornamental (O) and domesticated (D). b, The phenotypic diversity of shoots and fruits from a subset of Solanum species in the pan-genome. Scale bars, 5 cm (shoots) and 1 cm (fruits). c, Orthogroup-based phylogeny of the Solanum pan-genome recapitulates the major clades, grade I and clade II. The branch lengths reflect coalescent units. Ma, million years ago. d, Genome size (Gb) and representation of non-repetitive (light grey) and repetitive (dark grey) sequences of each species of the Solanum pan-genome. e, GENESPACE plot showing gene macrosynteny across the pan-genome relative to tomato. Scale bar, 9,000 genes.
Fig. 2
Fig. 2. Widespread paralogous diversification across Solanum revealed by multitissue gene expression analysis.
a, Schematic of dosage-constrained and dosage-unconstrained orthogroups reflecting different degrees of selection on the total dosage of paralogue pairs across species. b, PCA of the normalized expression matrix from 5,146 singleton genes shared across all 22 species. The expression matrix consists of the summed expression of paralogue pairs. Tissue samples are coloured by tissue identity. c, The tissue specificity of constrained and unconstrained paralogue pairs. Paralogue pairs under constrained total dosage across species are less tissue specific (left) than unconstrained paralogues (right). d, Schematic of four categories of functional expression groups of retained paralogues: group I, dosage balance; group II, paralogue dominance; group III, specialization; group IV, divergence. e, The distribution of paralogue pairs according to their co-expression level and mean log2[fold change (FC)] (top) or the s.d. of the log2[fold change] (bottom) in expression. The four derived paralogue expression groups are shown. f, Representatives of paralogue pairs capturing the different patterns of expression delimited across the pan-genome. Coty, cotyledon; hypo, hypocotyl; inflo, inflorescence. g, Genes included in the four paralogue expression groups display contrasting protein sequence similarity (top left), gene family size (top right), number of shared expression domains (tissues) (bottom left) or propensity to undergo gene loss for orthogroups in different dosage quartiles (bottom right). For all box plots, the box limits show the first and third quartiles, the centre line represents the median and the whiskers represent 1.5× the interquartile range. h, Cis-regulatory sequence conservation in the different expression groups in relation to increased selection on protein sequence. For each expression group, the predicted mean and 95% confidence interval of the normalized LastZ score is shown (details of the statistical analysis was provided in Supplementary Table 5). i, The proportion of each paralogue expression group attributed to paralogue pairs derived from either WGD or SSDs, showing increased divergence of paralogues from small-scale duplications.
Fig. 3
Fig. 3. Functional dissection of lineage-specific paralogue diversification through pan-genetics reveals modified compensatory relationships in a major fruit size regulator.
a, Pan-genome-wide gene presence/absence and copy-number variation in 17 orthogroups containing genes that are known to regulate three major domestication and improvement traits in tomato. The stars indicate partial or no gene function: hypomorphic allele or pseudogene. b, The haplotype diversification at the CLV3 locus across the eggplant clade is substantial. The presence/absence of CLV3 paralogues is shown. Lineage-specific CLV3 duplications are marked with asterisks. The green full circles denote functional CLV3 copies and the red half circles denote truncated/pseudogenized copies. The grey lines illustrate conservation, and the blue lines represent loss of synteny. c, CRISPR–Cas9 genome editing of CLV3 orthologues in three species of the eggplant clade. Engineered loss-of-function mutations in S. cleistogamum (ScleCLV3, top), S. aethiopicum (SaetCLV3a/b, middle) and S. prinophyllum (SpriCLV3a/b, bottom) resulted in severely fasciated stems and flowers in all three species. Scale bars, 1 cm. d, Quantification of SpriCLV3 paralogue-specific transcripts by RNA-seq. n = 4 biological replicates. e, Locules per fruit after paralogue-specific CRISPR gene editing of SpriCLV3a and SpriCLV3b in S. prinophyllum. Single paralogue mutants cause a subtle shift from bilocular to trilocular fruits; inactivation of both paralogues results in highly fasciated fruits. The arrowheads mark locules. Scale bars, 1 cm. f, Quantification of the locule number in single and double Spriclv3a and Spriclv3b mutants in S. prinophyllum showing paralogous CLV3 dosage relationships. The proportion of each locule number per genotype is shown. n represents the number of fruits counted, α represents the statistically significant group. Source data and additional statistical information, including P values, are provided in Supplementary Tables 8 and 9.
Fig. 4
Fig. 4. Pan-genome of African eggplant reveals widespread structural variation, wild species introgression and CLV3 paralogue diversification.
a, Images of field-grown African eggplant in Mukuno, Uganda (left) and New York, USA (right). b, Orthologue-based phylogeny of ten African eggplant accessions covering three main cultivar groups (Gilo, Shum and Aculeatum) and the wild progenitor S. anguivi. Representative shoots and fruits are shown for each accession. Scale bars, 5 cm (shoots). Genome summary statistics, including contig N50 (post-contamination screen) and post-assembly completeness, are indicated. The branch lengths reflect coalescent units. c, The number of SVs overlapping with genomic features across accessions. d, The presence/absence of and copy-number variation in CLV3 across the pan-genome. CLE9 is absent in all genotypes. S. aethiopicum and S. anguivi are shown for reference. e, Conservation of exonic microsynteny (grey bars) between SangCLV3, SaetCLV3REF and SaetCLV3DEL haplotypes. Scale bar, 100 kb. f, Long-read pile-up at the SaetCLV3 locus identifies a deletion structural variation and a distinct SaetCLV3 haplotype in accession 804750136. g, Diagram of a deletion–fusion allele of CLV3 (SaetCLV3DEL) that arose in accession 804750136. The 7 bp indel and single-nucleotide polymorphisms (SNPs) were used as markers to validate the deletion–fusion scenario.
Fig. 5
Fig. 5. Pan-genetic dissection of fruit locule variation in African eggplant.
a, Intraspecific crosses between representative accessions of each of the three main cultivated groups of African eggplant were used to generate F2 mapping populations for QTL-seq. Scale bars, 2 cm. b, Major-effect (1) and minor-effect (2) QTLs affecting the locule number, identified by bulk-segregant QTL-seq. ∆SNP indices for three identified QTL on chromosomes 2, 5 and 10 indicate the relative abundance of parental variants in bulked pools of F2 individuals (low- and high-locule classes) calculated in 2,000 kb sliding windows. c, The fruit locule number from phylogenetically arranged African eggplant accessions. The presence of the three mapped QTL alleles (different intensity green bars) in each accession is indicated on the phylogenetic tree. n represents the number of fruits counted, μ represents the average fruit locule number and α represents the statistically significant group. Source data and additional statistical information, including P values, are provided in Supplementary Tables 12 and 15. d, CRISPR–Cas9-engineered mutant alleles of SCPL25 serine carboxypeptidase orthologues in tomato (SlycSCPL25) and S. prinophyllum (SpriSCPL25) (left), along with representative images of transverse fruit sections from mutant plants (right) and quantification of fruit locule number (bottom), showing a consistent increase in fruit locule number across species. n represents the number of fruits counted, μ represents the average fruit locule number and α represents the statistically significant group. Source data and additional statistical information, including P values, are provided in Supplementary Tables 16 and 17. Scale bars, 1 cm. e, Schematics comparing the genetic basis of step changes underlying increased locule number and fruit size in tomato and African eggplant. The arrowheads in transverse fruit depictions indicate locules. The average fruit locule number (μ), fruit number (n) and statistically significant group (α) are indicated on the right of the stacked bar plots.
Extended Data Fig. 1
Extended Data Fig. 1. Pan-genomic analysis of orthogroup conservation and diversity of gene duplications.
(a) Orthogroups expansions and contractions across the pan-genome. The orthogroup-based phylogeny is adapted from Fig. 1c. The estimated expansion (blue) and contraction (orange) rates of orthogroups are shown at each node. (b) Cumulative curves showing detection of the four orthogroup conservation groups as a function of the number of species available in the pan-genome. (c) Schematic of the potential mechanisms underlying different gene duplication categories, also showing non-duplicated single copy genes for context (left). Stacked bar chart showing the number of genes derived from the different types of duplication sorted by orthogroup conservation groups (right). WGD: whole-genome duplication; TD: tandem duplication; PD: proximal duplication; TRD: transposed duplication; DSD: dispersed duplication; SC: single copy. (d) Functional enrichment of gene duplication types detected across the pan-genome. The top five enriched GO terms per duplication type are shown. Gene ratio represents the number of genes with a specific GO term divided by the total number of genes with GO terms in that category. (e) Divergence of protein and cis-regulatory sequences across increasing evolutionary pressure, as measured by Ka/Ks values, for the indicated types of gene duplication. BLASTP (protein sequence conservation) and LastZ (cis-regulatory sequence conservation from the Conservatory algorithm) normalized alignment scores were used to plot the predicted mean and 95% confidence interval (see Supplementary Table 5 for statistical analysis).
Extended Data Fig. 2
Extended Data Fig. 2. Paralog pairs expression analysis.
(a) Schematic of dosage-constrained and dosage-unconstrained orthogroups reflecting different degrees of selection on the total dosage of paralog pairs across species. Orthogroup 1 has paralog pairs with identical total dosage across species, whereas orthogroup 2 has different total dosages in each species. For each tissue, orthogroup and species, the total dosage of two paralogs is compared with that of the two homologues in each of the remaining species, and deviations from the expected ratio of total dosages are classified as “unconstrained”. This is repeated for all species that share the orthogroup and expressed in the tissue of interest, and the majority classification across species is taken as the classification for the entire orthogroup. Therefore, orthogroup 1 is classified as “dosage-constrained” while orthogroup 2 is classified as “dosage-unconstrained”. (b) The fraction of uniquely mapped reads for each tissue sample and species (left), and the average gene expression correlation with other samples from the same tissue and species (right). Red arrows in both cases point to the five outlier samples excluded from further analysis. For all boxplots, the bounds of the box represent the first and third quartiles, the thick line represents the median and the whiskers represent 1.5× the interquartile range. (c) Sankey plot shows the concordance between classification of paralog pairs based on two independent approaches (total dosage conservation and conservation of expression levels and profiles). Thickness of lines connecting each pair of groups shows the odds ratio of enrichment. (d) Line plots showing examples of paralog pairs in each of the four groups of paralog expression patterns. (e) Proportion of expressed paralog pairs classified into one of four expression groups at different coexpression and fold-change thresholds in 15 species. Individual bars are coloured by expression groups. (f) Relationship of protein and cis-regulatory sequence conservation on the different paralog expression groups over increasing evolutionary pressure. For each expression group the predicted mean, 95% confidence interval, and residuals of the normalized LastZ score are shown (see Supplementary Table 5 for statistical analysis).
Extended Data Fig. 3
Extended Data Fig. 3. Extreme variation in transposable elements and resistant gene content at the CLV3 locus across Solanum.
(a) Gene and transposable element compositions are highly variable at the CLV3 locus across the eggplant clade. While most of the gene content shows collinearity, the transposable element profile and density varies considerably. Stacked bars show the absolute number and type of transposable element for the window of three genes. (b) Microsyntenic relationships at the CLV3 locus across the eggplant clade show dynamic expansions and contractions of resistance genes. Resistance genes are identified by blue dots. Presence-absence of CLV3 paralogs is shown as in Fig. 3. Lineage-specific CLV3 duplications denoted with asterisks. Window sizes range from 397,829 bp (S. torvum) to 634,079 bp (S. aethiopicum) and are centred on the CLV3 locus. Functional CLV3 copies are denoted by green full circles while truncated/pseudogenized copies are shown as red half circles, as in Fig. 3. Grey lines illustrate conservation, while blue lines represent loss of synteny. (c) CRISPR/Cas9 gene-edited loss-of-function null alleles of CLV3 genes in S. prinophyllum and S. cleistogamum. (d) CRISPR/Cas9 gene-edited loss-of-function null alleles of African eggplant SaetCLV3a/b. Numbers represent the proportion of cloned and sequenced SaetCLV3a/b alleles as a ratio of the total number of clones sequenced in the three first-generation transgenic (T0) plants showing fasciation phenotypes.
Extended Data Fig. 4
Extended Data Fig. 4. Structural variants and gene copy number variation in the African eggplant pan-genome.
(a) Pan-genomic features across the African eggplant reference genome. Frequencies of: (i) sequences private to the reference, (ii) core sequence, (iii) genes, (iv) transposable elements, and (v) SVs. (b) Average SV lengths (bp) for deletions (dotted lines) and insertions (solid lines) across the three African eggplant cultivar groups. (c) Structural variant density across all chromosomes in African eggplant and its wild progenitor S. anguivi in 2 Mbp windows. (d) Percentage of structural variants overlapping with different genomic features. For all boxplots, the bounds of the box represent the first and third quartiles, the thick line represents the median and the whiskers represent 1.5× the interquartile range. (e) Jaccard similarity of SVs across the African eggplant pan-genome measured against S. anguivi in 2 Mbp windows. Putative introgression from S. anguivi on chromosomes 3, 4, 11, and 12 are highlighted by red boxes. (f) Close-up of chromosome 4 introgression shown by SV density. (g) SV density surrounding the SaetCLV3 locus across the pan-genome. Genomic positions of SaetCLV3a and SaetCLV3b are shown. Window size: 10 kbp. (h) Gene presence-absence and copy number variation in 17 orthogroups containing known genes regulating three major domestication traits in tomato across the African eggplant pan-genome and S. anguivi. Stars mark gene truncation or pseudogenization.
Extended Data Fig. 5
Extended Data Fig. 5. Interactions between the CLV3 and Chr5 African eggplant locule number QTLs in F2 populations.
(a) Mean fruit locule number for plants from the 804750136 × PI 424860 (left) and 804750187 × PI 424860 (right) derived segregating F2 populations grown in 2022 and used for QTL-seq analysis. Average locule counts for the parental genotypes are also shown. (b) Stacked bar plots showing fruit locule number from genotyped F2 (summer 2022, left) and F3 (summer 2024, right) plants derived from the 804750136 × PI 424860 cross. The genotyped reference (REF) and alternative (ALT) alleles of SaetCLV3 and the chromosome 5 QTLs are presented. HET: heterozygous, P: parents. (c) Stacked bar plots as in (b) but showing the effects of alleles at each locus individually. Average fruit locule number (μ), fruit number (n) and statistically significant group (α) are indicated to the right of stacked bar plots. See Supplementary Tables 12–14, 18 and 19 for Source data and additional statistical information, including p-values.

References

    1. Mascher, M., Jayakodi, M., Shim, H. & Stein, N. Promises and challenges of crop translational genomics. Nature636, 585–593 (2024). - PMC - PubMed
    1. Schreiber, M., Jayakodi, M., Stein, N. & Mascher, M. Plant pangenomes for crop improvement, biodiversity and evolution. Nat. Rev. Genet.25, 563–577 (2024). - PMC - PubMed
    1. Renard, D. & Tilman, D. National food production stabilized by crop diversity. Nature571, 257–260 (2019). - PubMed
    1. Shorinola, O. et al. Integrative and inclusive genomics to promote the use of underutilised crops. Nat. Commun.15, 320 (2024). - PMC - PubMed
    1. Ye, C.-Y. & Fan, L. Orphan crops and their wild relatives in the genomic era. Mol. Plant14, 27–39 (2021). - PubMed

LinkOut - more resources