. 2025 May;641(8061):129-136.
doi: 10.1038/s41586-025-08663-2. Epub 2025 Mar 5.

Canopy functional trait variation across Earth's tropical forests

Jesús Aguirre-Gutiérrez  1   2 Sami W Rifai  3 Xiongjie Deng  4 Hans Ter Steege  5   6 Eleanor Thomson  4 Jose Javier Corral-Rivas  7 Aretha Franklin Guimaraes  8 Sandra Muller  9 Joice Klipel  9   10 Sophie Fauset  11 Angelica F Resende  12   13 Göran Wallin  4   14 Carlos A Joly  15   16 Katharine Abernethy  13   17 Stephen Adu-Bredu  18   19 Celice Alexandre Silva  20 Edmar Almeida de Oliveira  21 Danilo R A Almeida  12 Esteban Alvarez-Davila  22 Gregory P Asner  23 Timothy R Baker  24 Maíra Benchimol  25 Lisa Patrick Bentley  26 Erika Berenguer  4   27 Lilian Blanc  28 Damien Bonal  29 Kauane Bordin  30 Robson Borges de Lima  31 Sabine Both  32 Jaime Cabezas Duarte  33   34 Domingos Cardoso  35   36 Haroldo C de Lima  36 Larissa Cavalheiro  37 Lucas A Cernusak  38 Nayane Cristina C Dos Santos Prestes  21 Antonio Carlos da Silva Zanzini  39 Ricardo José da Silva  20 Robson Dos Santos Alves da Silva  20 Mariana de Andrade Iguatemy  36   40 Tony César De Sousa Oliveira  41   42 Benjamin Dechant  43   44 Géraldine Derroire  28   45 Kyle G Dexter  46   47   48 Domingos J Rodrigues  37 Mário Espírito-Santo  49 Letícia Fernandes Silva  50   51 Tomas Ferreira Domingues  52   53 Joice Ferreira  54 Marcelo Fragomeni Simon  55 Cécile A J Girardin  4 Bruno Hérault  28 Kathryn J Jeffery  13 Sreejith Kalpuzha Ashtamoorthy  56 Arunkumar Kavidapadinjattathil Sivadasan  56 Bente Klitgaard  57 William F Laurance  38 Maurício Lima Dan  58 William E Magnusson  8 Eduardo Malta Campos-Filho  59 Rubens Manoel Dos Santos  60 Angelo Gilberto Manzatto  61 Marcos Silveira  62 Ben Hur Marimon-Junior  63 Roberta E Martin  23 Daniel Luis Mascia Vieira  55 Thiago Metzker  64   65 William Milliken  66 Peter Moonlight  67 Marina Maria Moraes de Seixas  54 Paulo S Morandi  68 Robert Muscarella  69 María Guadalupe Nava-Miranda  70   71 Brigitte Nyirambangutse  72   73 Jhonathan Oliveira Silva  74 Imma Oliveras Menor  4   75 Pablo José Francisco Pena Rodrigues  36 Cinthia Pereira de Oliveira  31 Lucas Pereira Zanzini  76 Carlos A Peres  77 Vignesh Punjayil  56 Carlos A Quesada  78 Maxime Réjou-Méchain  75 Terhi Riutta  4   79 Gonzalo Rivas-Torres  80 Clarissa Rosa  8 Norma Salinas  81 Rodrigo Scarton Bergamin  82   83 Beatriz Schwantes Marimon  63 Alexander Shenkin  84 Priscyla Maria Silva Rodrigues  74 Axa Emanuelle Simões Figueiredo  85 Queila Souza Garcia  86 Tereza Spósito  64 Danielle Storck-Tonon  87 Martin J P Sullivan  88 Martin Svátek  89 Wagner Tadeu Vieira Santiago  90 Yit Arn Teh  91 Prasad Theruvil Parambil Sivan  56 Marcelo Trindade Nascimento  92 Elmar Veenendaal  93 Irie Casimir Zo-Bi  94 Marie Ruth Dago  94 Soulemane Traoré  94   95 Marco Patacca  96 Vincyane Badouard  45   75   94 Samuel de Padua Chaves E Carvalho  97 Lee J T White  13   17 Huanyuan Zhang-Zheng  4   98 Etienne Zibera  14   99 Joeri Alexander Zwerts  100 David F R P Burslem  101 Miles Silman  102   103 Jérôme Chave  104 Brian J Enquist  105   106 Jos Barlow  27 Oliver L Phillips  24 David A Coomes  107 Yadvinder Malhi  4   98
Affiliations

Canopy functional trait variation across Earth's tropical forests

Jesús Aguirre-Gutiérrez et al. Nature. 2025 May.

Abstract

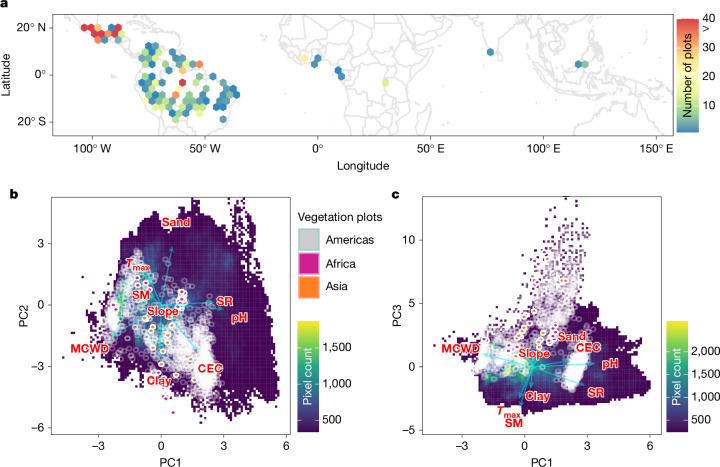
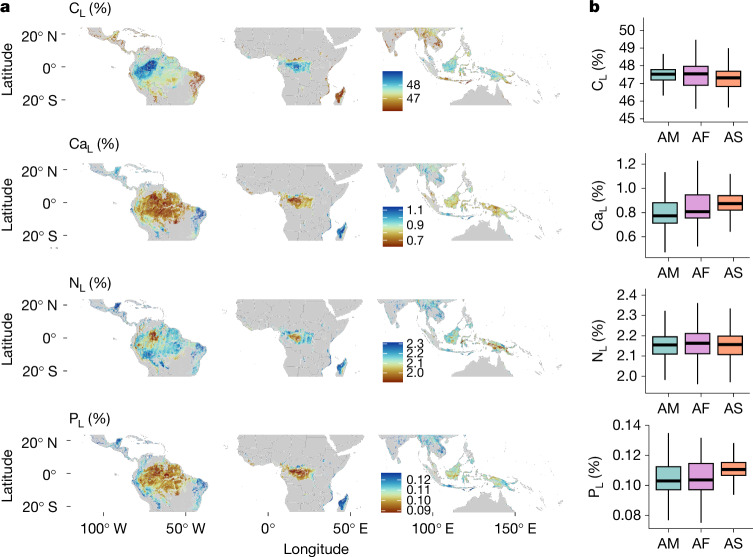
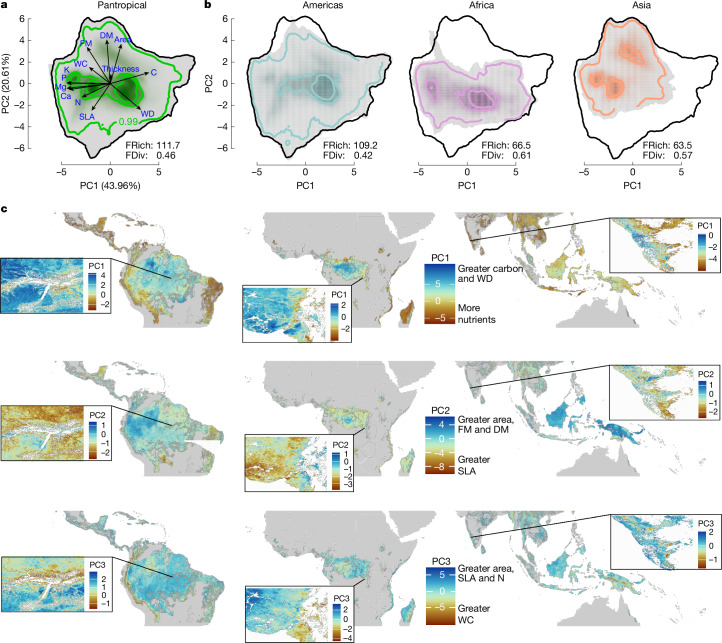
Tropical forest canopies are the biosphere's most concentrated atmospheric interface for carbon, water and energy1,2. However, in most Earth System Models, the diverse and heterogeneous tropical forest biome is represented as a largely uniform ecosystem with either a singular or a small number of fixed canopy ecophysiological properties3. This situation arises, in part, from a lack of understanding about how and why the functional properties of tropical forest canopies vary geographically4. Here, by combining field-collected data from more than 1,800 vegetation plots and tree traits with satellite remote-sensing, terrain, climate and soil data, we predict variation across 13 morphological, structural and chemical functional traits of trees, and use this to compute and map the functional diversity of tropical forests. Our findings reveal that the tropical Americas, Africa and Asia tend to occupy different portions of the total functional trait space available across tropical forests. Tropical American forests are predicted to have 40% greater functional richness than tropical African and Asian forests. Meanwhile, African forests have the highest functional divergence-32% and 7% higher than that of tropical American and Asian forests, respectively. An uncertainty analysis highlights priority regions for further data collection, which would refine and improve these maps. Our predictions represent a ground-based and remotely enabled global analysis of how and why the functional traits of tropical forest canopies vary across space.


Conflict of interest statement

Competing interests: The authors declare no competing interests.

Figures

Fig. 1
Fig. 1. Study area and PCA.
a, Study area, showing the distribution of 1,814 vegetation plots across the original biome space for tropical forests (grey background) in the Americas (659.6 ha), Africa (124.6 ha) and Asia (15.4 ha). b,c, PCA (PC1 and PC2, b; PC3, c) depicting the environmental space found across the tropics (yellow and green colours show higher map pixel counts representing area covered) on the basis of mean maximum air temperature (Tmax), soil moisture (SM), solar radiation (SR), slope, MCWD, soil cation-exchange capacity (CEC), soil pH, sand amount and clay amount. The grey, violet and orange points show the location of the sampling plots in environmental space found across the tropics. PC1 accounts for 27% of explained variance, PC2 for 24% and PC3 for 14%, with all three accounting for 65% of the total explained variance. PC1 is loaded mainly by water deficit index (MCWD) (−0.47), SR (0.50) and soil pH (0.59); PC2 by the soil sand (0.57), clay (−0.53) and CEC (−0.44); and PC3 by SM (−0.63) and Tmax (−0.49). Climate data were derived for each pixel from the TerraClimate project and soil data were derived from SoilGrids.org.
Fig. 2
Fig. 2. Predicted distribution of CWM morphological and structural plant traits.
a, Predicted distribution of a selection of CWM morphological and structural plant traits. Red to orange show areas with low to intermediate trait values; light to dark blue depict areas with intermediate to high trait values. The remaining morphological traits and the spatial predictions of their uncertainty are shown in Supplementary Figs. 1–7. b, Box plots showing the CWM trait distribution values for tropical American (AM), African (AF) and Asian (AS) forests, extracted from the spatial predictions. The horizontal black lines depict the median CWM trait value and vertical lines show the whiskers extending to the largest CWM trait value or not further than 1.5 times the interquartile range. For visualization purposes, we excluded the extreme lowest and highest 1% of values in the maps in a and outliers in b. AreaL, leaf area; ThicknessL, leaf thickness; WD, wood density. For statistical model results, see Supplementary Table 1. For the significance of differences between CWM trait mean values, obtained using a t-test with Bonferroni correction, see Supplementary Table 2.
Fig. 3
Fig. 3. Predicted distribution of CWM leaf nutrient plant traits.
a, Predicted distribution of a selection of CWM leaf nutrient plant traits. Red to orange show areas with low to intermediate trait values; light to dark blue depict areas with intermediate to high trait values. The remaining chemistry traits and the spatial predictions of their uncertainty are shown in Supplementary Figs. 8–13. b, Box plots showing the CWM trait distribution values for tropical American (AM), African (AF) and Asian (AS) forests, extracted from the spatial predictions. The horizontal black lines depict the median CWM trait value and vertical lines show the whiskers extending to the largest CWM trait value or not further than 1.5 times the interquartile range. For visualization purposes, we excluded the extreme lowest and highest 1% of values in the maps in a and outliers in b. CL, leaf carbon concentration; CaL, leaf calcium concentration; NL, leaf nitrogen concentration; PL, leaf phosphorus concentration. For statistical model results, see Supplementary Table 1. For the significance of differences between CWM trait mean values, obtained using a t-test with Bonferroni correction, see Supplementary Table 2.
Fig. 4
Fig. 4. Functional diversity of tropical forests in the Americas, Africa and Asia.
a, Functional trait space of trees across tropical forests in the Americas, Africa and Asia (including Australia), with principal component PC1 explaining 44% and PC2 20.6% of the variance in plant traits distributions. Arrows indicate the contribution and direction of each trait for the PCA. b, Distribution of functional trait space for the tropical American (left), African (middle) and Asian (right; including Australia) forests separately. a and b show the probabilistic density distribution defined by the PC1 and PC2 space of the 13 plant functional traits used: area, leaf area; C, leaf carbon concentration; Ca, leaf calcium concentration; K, leaf potassium concentration; Mg, leaf magnesium concentration; N, leaf nitrogen concentration; P, leaf phosphorus concentration; DM, leaf dry mass; FM, leaf fresh mass; SLA, specific leaf area; thickness, leaf thickness; WC, leaf water content; WD, wood density (see Extended Data Table 1 for a description of the trait used). The inner colour gradient represents the density of pixels in the PC trait space. Thick contour lines depict the 0.5 and 0.99 quantiles. FRich shows the functional richness and FDiv the functional divergence for the global trait space across continents (a) and for tropical American (b, left), African (b, middle) and Asian (b, right) forests. c, PC1 (top), PC2 (middle) and PC3 (bottom, explaining 13% of the variance) from a predicted across tropical forests. Co-occurring trait syndromes or strategies are shown, with insets magnified to show greater details of the predicted plant strategies.
Extended Data Fig. 1
Extended Data Fig. 1. The importance of spectral data, vegetation indices, canopy texture parameters, climate, terrain and soil conditions for model prediction of each plant trait.
AreaL: leaf area, CL: leaf carbon concentration, CaL: leaf calcium concentration, DML: leaf dry mass, FML: leaf fresh mass, KL: leaf potassium concentration, MgL: leaf magnesium concentration, NL: leaf nitrogen concentration, PL: leaf phosphorus concentration, SLA: specific leaf area, ThicknessL: leaf thickness, WCL: leaf water content, WD: wood density (see Extended Data Table 1 for a description of the trait used). The importance of each variable for each trait can be seen in Supplementary Figs. 1–13. The importance values were obtained from the RF models.
Extended Data Fig. 2
Extended Data Fig. 2. Predicted distribution of field sampling needs.
The map shows the locations where higher standard error of predictions of CWM trait values are found with orange showing high, yellow showing intermediate and green showing low sampling needs. The map was obtained by standardizing each CWM standard error (s.e.)-mapped prediction from 0 to 1 and obtaining an average value of the sum of those standardized SE maps. From this final field sampling needs map, we calculated the areas belonging to the lowest, middle and highest 33 percentiles and classified these as ‘Low’, ‘Intermediate’ and ‘High’ respectively. This final map could aid in generating field sampling priorities for the traits used in this study.
Extended Data Fig. 3
Extended Data Fig. 3. Percentage area covered by traits at the pixel level.
Pixels had a minimum of 70% of the trees’ basal area covered with trait data to enter the analysis. As shown, in several cases we reached higher than 70% basal area coverage at the pixel level. AreaL: leaf area, CL: leaf carbon concentration, CaL: leaf calcium concentration, DML: leaf dry mass, FML: leaf fresh mass, KL: leaf potassium concentration, MgL: leaf magnesium concentration, NL: leaf nitrogen concentration, PL: leaf phosphorus concentration, SLA: specific leaf area, ThicknessL: leaf thickness, WCL: leaf water content, WD: wood density.

References

    1. Gatti, R. C. et al. The number of tree species on Earth. Proc. Natl Acad. Sci. USA119, e2115329119 (2022). - PMC - PubMed
    1. Barlow, J. et al. The future of hyperdiverse tropical ecosystems. Nature559, 517–526 (2018). - PubMed
    1. Silman, M. R. Functional megadiversity. Proc. Natl Acad. Sci. USA111, 5763–5764 (2014). - PMC - PubMed
    1. Wieczynski, D. J. et al. Climate shapes and shifts functional biodiversity in forests worldwide. Proc. Natl Acad. Sci. USA116, 587–592 (2019). - PMC - PubMed
    1. Mace, G. M., Norris, K. & Fitter, A. H. Biodiversity and ecosystem services: a multilayered relationship. Trends Ecol. Evol.27, 19–26 (2012). - PubMed

LinkOut - more resources