. 2025 Mar 5;15(1):7689.
doi: 10.1038/s41598-025-92530-7.

The landscape of renal protein S-acylation in mice with lipid-induced nephrotoxicity

Affiliations

The landscape of renal protein S-acylation in mice with lipid-induced nephrotoxicity

Fangrui Xiu et al. Sci Rep. .

Abstract

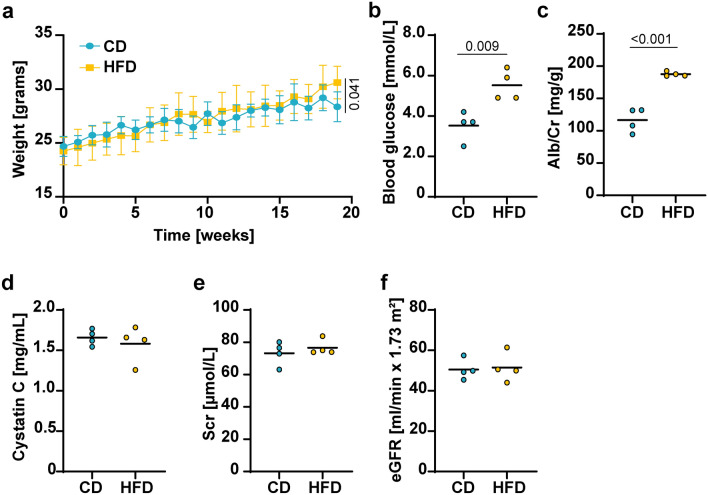
Excess fat intake is associated with kidney toxicity and dysfunction. Because fatty acids can also be reversibly attached onto cysteine residues and modulate the function of several membrane-bound proteins, we studied the effect of high-fat diet (HFD) on the S-acylated proteome of mouse kidneys to uncover novel biochemical changes that might contribute to lipid-induced nephrotoxicity. We compared the S-acylated proteome of kidneys from mice fed a chow diet (CD) or a HFD. HFD caused albuminuria. The HFD intervention induced a large-scale repression of protein S-acylation as well as of the most abundant ceramides and sphingomyelin species, which are highly suggestive of a reduction in acyl-CoA availability. The HFD-induced S-acylation repression mostly affected proteins involved in endocytosis and intracellular transport. Notably, the kidneys of mice fed a HFD displayed a marked decrease in the total amount and in the S-acylated form of megalin, the main tubular protein retrieval system. Further in vitro experiments indicated that S-acylation inhibition results in a reduction of megalin protein level. We conclude that diet-induced derangement of fatty acid metabolism modifies the renal landscape of the S-acylated proteome during the early stages of the kidney injury, which might reduce the efficiency of protein reabsorption by the proximal tubule.

Keywords: Chronic kidney disease; High-fat diet; Proteinuria; Proteomics, S-acylation; S-palmitoylation.


Conflict of interest statement

Declarations. Competing interests: The authors declare no competing interests. Ethical approval and consent to participate: Experiments involving animals are described in accordance with ARRIVE guidelines.

Figures

Fig. 1
Fig. 1
Metabolic and renal function parameters. (a) Body weight over time. Data are presented as mean ± SD (n = 4). (b) Fasting blood glucose level. (c-e) Urinary Albumin-to-Creatinine (Alb/Cr) (C), serum Cystatin C (D), and serum creatinine (E) level. (f) Estimated glomerular filtration rate (eGFR) calculated as follows: CKD-EPI creatinine-cystatin Eq. (2021): eGFRcr-cys = 135 × min(Scr/κ, 1)α × max(Scr/κ, 1)−0.544 × min(Scys/0.8, 1)−0.323 × max(Scys/0.8, 1)−0.778 × 0.9961Age × 0.963 [if female]; Scr = standardized serum creatinine in mg/dL, κ = 0.7 (females) or 0.9 (males), α = − 0.219 (female) or − 0.144 (male), min(Scr/κ, 1) is the minimum of Scr/κ or 1.0, max(Scr/κ, 1) is the maximum of Scr/κ or 1.0, Scys = standardized serum cystatin C in mg/L, Age (years). Comparisons of the means was performed by unpaired Student’s t-test. In the scatter plots, each dot represents one individual sample.
Fig. 2
Fig. 2
S-acylated proteomic profile in CD and HFD groups. (a) Matrix bubble plot of the proteins found S-acylated exclusively either in the CD or in the HFD group (S-acylated proteins, dark blue and red), and their relative abundance in the input fraction (total protein, light blue and yellow). (b) Volcano plot comparing abundance of the S-acylated form normalized for the abundance in the input fraction (total protein) of S-acylated proteins found in the kidney of both CD and HFD mice (Integrated S-acylated proteome). The relative abundance (log2 FC) is reported on the x-axis, the significance (-log10 FDR) on the y-axis. The vertical and horizontal lines show the cut-off of FC =  ± 1.0, and of FDR = 0.1, respectively. (c) Anatomy-guided single-cell transcriptomic-derived pie-chart of the localization of the differentially S-acylated proteins throughout the nephron and collecting system, generated from the Kidney Cell Explorer open access software (https://github.com/qinzhu/kidneycellexplorer).
Fig. 3
Fig. 3
Total expression level of S-acylation-related enzymes. (a, b) Heatmap cluster analysis and scatter dot plots of the relative total abundance of the indicated proteins in the input fraction (total protein) from crude membranes isolated from the kidney of CD and HFD mice. In all scatter plots, each dot represents one individual sample. Comparisons of the means was performed by unpaired Student’s t-test.
Fig. 4
Fig. 4
Diet-induced renal lipid signature shift. (a) Heatmap cluster analysis of the top 70 lipid species in the crude membrane fraction isolated from the kidney of CD and HFD groups. Absolute levels of each species were measured relative to an internal lipid standard. (b) Volcano plot comparing the 382 lipid species identified by LC–MS/MS between CD and HFD groups. The fold-change of concentration (log2 FC) is reported on the x-axis, the significance (-log10 FDR) on the y-axis. The vertical and horizontal dotted lines show the cut-off of fold-change =  ± 0.5, and of FDR = 0.1, respectively. (c) Scatter dot plots of the total relative abundance of the indicated lipids in crude membranes isolated from the kidney of CD and HFD mice. In all scatter dot plots, absolute levels of each lipid species relative to an internal lipid standard are shown. Each dot represents one individual sample. Comparisons of the means was performed by unpaired Student’s t-test.
Fig. 5
Fig. 5
Pathway and disease enrichment analysis. (a, b) DisGeNET (disgenet2r package) kidney-related disease enrichment analysis with respect to the main site of expression of the differentially S-acylated proteins. The significance (FDR) of enrichment gradually increases from light to dark color, and the size of the dots indicates the number of genes contained in the corresponding pathway. (c, d) Circle plot of GO enrichment analysis. Each spot in the circle represents an S-acylated protein, and the outer circle refers to significantly enriched biological pathways. The inner circle shows the Z-score, the color intensity corresponds to the value of the Z-score. Top-ten significantly enriched GO pathways are listed.
Fig. 6
Fig. 6
S-acylated and total protein level of megalin. (a) Megalin position in Volcano plots. The relative abundance (log2 FC) is reported on the x-axis, the significance (-log10 FDR) on the y-axis. The vertical and horizontal lines show the cut-off of fold-change =  ± 1.0, and of FDR = 0.1, respectively. (b) Computational prediction of S-acylated cysteine residues of megalin protein sequence using the SwissPalm open access database (https://swisspalm.org). (c) Representative Western blotting of megalin and Na+/K+-ATPase expression in HEK293 cells incubated for 48 h with 100 μM 2-BP. Densitometric quantification of the megalin band normalized by that of the Na+/K+-ATPase. (d) Gentamicin surface bound fraction in HEK293 cells incubated for 48 h with 2-BP. In scatter plots, each data point represents one independent experiment. The indicated p-values were calculated from the unpaired Student’s t-test.
Fig. 7
Fig. 7
Summary. In mice fed high fat diet (HFD) with elevated albuminuria, the acyl-CoA Synthetase Family Member 2 (ACSF2) renal protein expression level is lower than in mice fed a chow diet (CD), resulting in lower level of acyl-CoA and protein S-acylation. Megalin hypo-acylation causes a reduction in megalin total protein expression level, which may contribute to the elevated albuminuria. Created in BioRender. Visentin, M. (2025) https://BioRender.com/e18k722.

References

    1. Levey, A. S. et al. Nomenclature for kidney function and disease: Report of a Kidney Disease: Improving Global Outcomes (KDIGO) Consensus Conference. Kidney Int.97, 1117–1129. 10.1016/j.kint.2020.02.010 (2020). - PubMed
    1. Thomas, M. C. et al. Diabetic kidney disease. Nat. Rev. Dis Primers1, 15018. 10.1038/nrdp.2015.18 (2015). - PMC - PubMed
    1. Jha, V. et al. Chronic kidney disease: Global dimension and perspectives. Lancet382, 260–272. 10.1016/S0140-6736(13)60687-X (2013). - PubMed
    1. Adler, A. I. et al. Development and progression of nephropathy in type 2 diabetes: The United Kingdom Prospective Diabetes Study (UKPDS 64). Kidney Int.63, 225–232. 10.1046/j.1523-1755.2003.00712.x (2003). - PubMed
    1. Wong, T. Y., Shankar, A., Klein, R. & Klein, B. E. Retinal vessel diameters and the incidence of gross proteinuria and renal insufficiency in people with type 1 diabetes. Diabetes53, 179–184. 10.2337/diabetes.53.1.179 (2004). - PubMed

LinkOut - more resources