. 2025 Apr;5(4):607-621.
doi: 10.1038/s43587-025-00819-z. Epub 2025 Mar 5.

Single-cell immune aging clocks reveal inter-individual heterogeneity during infection and vaccination

Affiliations

Single-cell immune aging clocks reveal inter-individual heterogeneity during infection and vaccination

Wenchao Li et al. Nat Aging. 2025 Apr.

Abstract

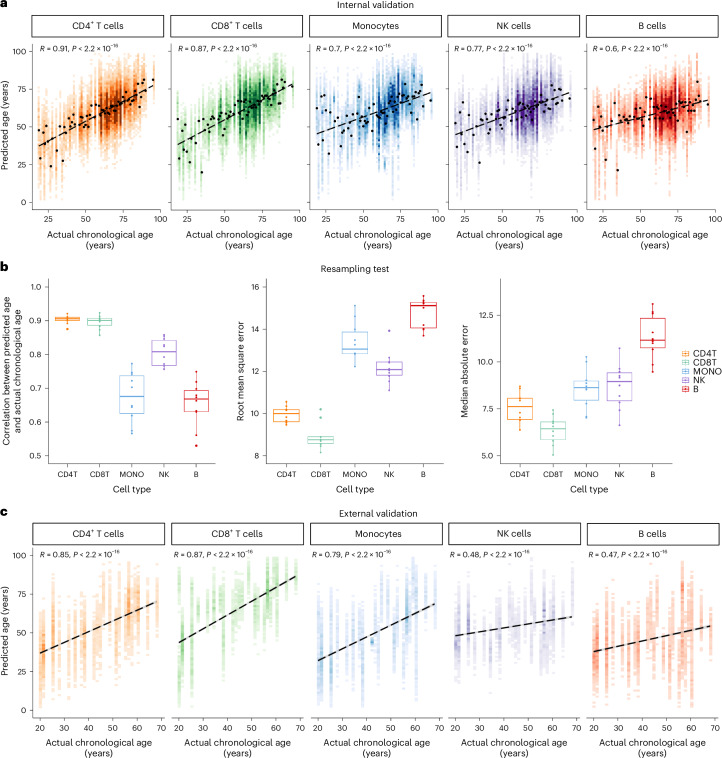
Aging affects human immune system functionality, increasing susceptibility to immune-mediated diseases. While gene expression programs accurately reflect immune function, their relationship with biological immune aging and health status remains unclear. Here we developed robust, cell-type-specific aging clocks (sc-ImmuAging) for the myeloid and lymphoid immune cell populations in circulation within peripheral blood mononuclear cells, using single-cell RNA-sequencing data from 1,081 healthy individuals aged from 18 to 97 years. Application of sc-ImmuAging to transcriptome data of patients with COVID-19 revealed notable age acceleration in monocytes, which decreased during recovery. Furthermore, inter-individual variations in immune aging induced by vaccination were identified, with individuals exhibiting elevated baseline interferon response genes showing age rejuvenation in CD8+ T cells after BCG vaccination. sc-ImmuAging provides a powerful tool for decoding immune aging dynamics, offering insights into age-related immune alterations and potential interventions to promote healthy aging.


Conflict of interest statement

Competing interests: M.G.N. is a scientific founder of Lemba, TTxD, and Biotrip. The other authors declare no competing interests.

Figures

Fig. 1
Fig. 1. Workflow of establishing cell-type-specific aging clocks, sc-ImmuAging.
The establishment and application of our aging clocks involve four main steps. (1) Data pre-processing: five publicly available scRNA-seq datasets from human PBMC are collected, including 1,081 healthy European individuals aged from 18 to 97 years. Next, quality control, integration, and cell-type annotation are conducted. In the following analysis, we focus on five major cell types, including B cells, NK cells, CD4+ T cells, CD8+ T cells and monocytes. (2) Model establishment: 80% of individuals are randomly selected for model training. Pearson correlation, mutual information and MIRA are used and compared in terms of feature selection. The selected features are trained by LASSO, random forest, and PointNet, respectively. Finally, cell-type-specific aging clocks are developed for each cell type. Subsequently, evaluation is performed using an internal testing set, including 20% individuals. See Methods for details. (3) External validation: An independent external validation dataset of 42 healthy European individuals from five published datasets is used. Then the Pearson correlation coefficient, r.m.s.e., and m.a.e. between actual age and predicted transcriptome age (Tx age) are calculated to evaluate the accuracy of the model. (4) Application: We apply our established cell-type-specific aging clock model on vaccination and infectious diseases cohorts as case studies. We aim to examine which cell types exhibit the substantial age acceleration/rejuvenation in response to infectious diseases or vaccination. Furthermore, we explore the genes and pathways that contribute to age alterations. Fig. 1 was created with BioRender.com.
Fig. 2
Fig. 2. Evaluations on internal and external dataset show accuracy and robustness of aging clocks.
a, Internal validation: Pearson correlation (two-sided test) is plotted between actual chronological age and predicted age for each cell type. Linear fit is plotted as a dashed line. b, To verify the robustness of the aging clock models, the training set and internal validation set are randomly resampled, and the model is trained for 10 times. Pearson correlation (two-sided test), r.m.s.e., and m.a.e. are used as evaluation criteria. In the boxplots: center, median; box limits, upper and lower quartiles; points, resampling; whiskers, 1.5× interquartile range. CD4T, CD4+ T cells; CD8T, CD8+ T cells; MONO, monocytes; NK, NK cells; B, B cells. c, External validation: Pearson correlation (two-sided test) is plotted between actual chronological age and predicted age in each cell type. Linear fit is plotted as a dashed line. Source data
Fig. 3
Fig. 3. Characteristics of the established cell-type-specific aging clocks.
a, The upset plot of the intersections of the captured marker genes, with non-zero coefficients, between cell-type-specific aging clocks. b, Top enriched pathways of the captured marker genes in each cell-type-specific aging clock model. Pathways with Benjamini–Hochberg adjusted P < 0.05 are considered significant. c, Evaluation of the specificity of cell-type-specific aging clocks across cell types. The x axis shows the cross tested of each model across cell types, and the y axis represents the trained model. Dot size denotes the Pearson correlation (COR) between actual chronological age and predicted age. The darkness of color represents the r.m.s.e. d, Trajectory of mean expression of top marker gene in each cell type. The genes on the first row have positive coefficients, and genes in the second row have negative coefficients. Source data
Fig. 4
Fig. 4. Monocytes undergo substantial age acceleration in response to COVID-19.
a, Boxplot of the age shifts in healthy control and patients with mild and severe COVID-19 in each cell type, calculated as the predicted age subtract by the actual chronological age. See details in Methods. Boxplots: center, median; box limits, upper and lower quartiles; whiskers, 1.5× interquartile range. Two-sided Wilcoxon test: PB:control-mild = 0.0314, PB:control-severe = 0.0485, PCD4T:control-mild = 0.0011, PCD4T:control-severe = 0.000449, PCD8T:control-severe = 0.0348, PMONO:control-mild = 0.00298, PMONO:control-severe = 0.000323; NS, not significant. b, Enriched pathways are calculated by the intersected genes between marker genes and up-regulated genes in patients with mild/severe COVID-19 compared to healthy control in monocytes. Pathways with Benjamini–Hochberg adjusted P < 0.05 are considered significant. c, Enriched pathways are calculated by the intersected genes between marker genes and down-regulated genes in patients with mild/severe COVID-19 compared to healthy control in monocytes. Pathways with Benjamini–Hochberg adjusted P < 0.05 are considered significant. d, Correlation between age shifts in monocytes and WHO severity score. Dashed line represents the linearly fitted curve between WHO severity score and TAA, with the 95% confidence interval (CI). e, Time series age shifts of patients with severe COVID-19 from two independent published scRNA-seq datasets. The x axis is days since symptom onset, and the y axis is the age shifts. Curve is fitted using “loess” function, with the 95% CI. f, Time series age shifts of severe and severe ICU patients from a single-nucleus RNA-seq dataset. ICU, intensive care unit. The x axis is days since positive PCR test result, and the y axis is the age shifts. Curve is fitted using loess function, with the 95% CI. Source data
Fig. 5
Fig. 5. CD8+ T cells exhibit diverse age alterations among individuals in response to BCG vaccination.
a, Age shifts in each cell type per individual. Red color means age acceleration after BCG vaccination, and green means the opposite. b, Significant correlation (Pearson correlation, P = 0.025, R = 0.4) between BCG efficacy, defined as the fold change of IFNγ between before and after vaccination with M. tuberculosis stimulation, and age shifts in CD8+ T cells. We define individuals with age rejuvenation as AR group and individuals with age acceleration as AA group. c, Enrichment analysis by using the genes which are marker genes and DEGs (compared between before (T0) and after (T3m) BCG vaccination, P < 0.05) in AR and AA groups. d, Dot plot of DEGs (adjusted P < 0.05), comparing before and after BCG vaccination at the whole transcriptome level in AR and AA groups, respectively. e, Pathway enrichment analysis of down-regulated genes after BCG vaccination compared with before BCG vaccination in the AR group. Pathways with Benjamini–Hochberg adjusted P < 0.05 are considered significant. f, Pathway enrichment analysis of up-regulated genes after BCG vaccination compared to before BCG vaccination in the AA group. Pathways with Benjamini–Hochberg adjusted P < 0.05 are considered significant. g, Unique gene regulatory network in the AR group. Targets are down-regulated after BCG vaccination. Diamonds refer to transcription factors, and circles refer to targets. The color of edges represents correlation between transcription factors and targets. Red means positive correlation, and blue means negative correlation. h, Unique gene regulatory network in the AA group. Targets are up-regulated after BCG vaccination. Diamonds refer to transcription factors, and circles refer to targets. The color of edges represents correlation between transcription factors and targets. Red means positive correlation, and blue means negative correlation. i, Schematic plot summarizing the age shifts and the involved biological processes in CD8+ T cells in AR group and AA group, respectively. Panels ci were created using BioRender.com. Source data
Extended Data Fig. 1
Extended Data Fig. 1. Overview of collected scRNA-seq datasets.
(a) UMAP of the scRNA-seq data. (b) Expression of marker genes for cell type annotations. (c) Age distributions for training set, internal testing set, and external testing set, respectively.
Extended Data Fig. 2
Extended Data Fig. 2. External validation performance.
(a) External validation on Röring et al. dataset, with average chronological age of 22 years, and Alaswad et al. dataset, with average chronological age of 60 years. Density plots of predicted age for these two datasets are compared. (b) Individuals from Rabold et al. dataset were categorized into those under 40 years old (average actual chronological age = 22, blue density plot) and over 40 years old (average actual chronological age = 46, red density plot), based on age distribution of the samples. Density plots represent the predicted age for each group. (c) Individuals from Debisarun et al. dataset are split into those under 35 years old (average actual chronological age = 32, blue density plot) and above 35 years old (average actual chronological age = 39, red density plot). Density plots represent the predicted age for each group. (d) Individuals from Grondman et al. dataset are grouped into those under 50 years old (average actual chronological age = 43, blue density plot) and over 50 years (average actual chronological age = 54.5, red density plot). Density plots represent the predicted age for each group. (e) Boxplot of comparison between top 100 marker genes (ranked by absolute coefficient) of each aging clock and randomly selected genes using training set (n = 864). The y axis is the −log10(P value) (two-sided wilcoxon test). Blue color means genes captured by the model and red color means random genes. boxplots: centre, median; box limits, upper and lower quartiles; whiskers, 1.5× interquartile range. Source data
Extended Data Fig. 3
Extended Data Fig. 3. Application of sc-ImmuAging on the independent COVID-19 cohorts.
(a) Boxplot of TAA for the Stephenson et al. cohort (n = 26). boxplots: centre, median; box limits, upper and lower quartiles; whiskers, 1.5× interquartile range. two-sided wilcoxon test: PMONO:control-severe = 0.0202; ns, not significant. (b) Boxplot of TAA for Zhang et al. cohort (n = 48). boxplots: centre, median; box limits, upper and lower quartiles; whiskers, 1.5× interquartile range. two-sided wilcoxon test: PMONO:post-severe = 0.000336, PMONO:mild-severe = 0.0107; ns, not significant. (c) Boxplot of TAA for Liu et al. cohort (n = 24). boxplots: centre, median; box limits, upper and lower quartiles; whiskers, 1.5× interquartile range. (d) Density plot of the predicted age for healthy control, mild and severe patients. The median value of each distribution is highlighted as a vertical line. Four groups of individuals with different age stages are plotted. Source data
Extended Data Fig. 4
Extended Data Fig. 4. Application of sc-ImmuAging on the MMR cohort.
(a) Density Plot of the predicted age of the Placebo-vaccinated group at before and after administration. Vertical line represents the median predicted age of each group. No differences are detected between two timepoints, suggesting the prediction accuracy of our model. (b) Density Plot of the predicted age of the MMR-vaccinated group at before and after administration. Vertical line represents the median predicted age of each group. We observe five years age acceleration in B cells, whereas four years age rejuvenation in CD8 + T cells. (c) Violin plot of the Interferon response gene score (Methods) for the MMR- and Placebo-vaccinated group at two time points. The y axis is the interferon gene score. We observe a notable decrease in the MMR-vaccinated group after administration, which is consistent with the result from the BCG-vaccinated group. No significant changes are observed in the Placebo-vaccinated group. two-sided wilcoxon test: PMMR:T1-T2 = 0.0019; ns, not significant. Source data

References

    1. Albright, J. F. & Albright, J. W. Aging, Immunity, and Infection (Humana, 2003).
    1. Head, T., Daunert, S. & Goldschmidt-Clermont, P. J. The aging risk and atherosclerosis: a fresh look at arterial homeostasis. Front. Genet.8, 216 (2017). - PMC - PubMed
    1. Hou, Y. et al. Ageing as a risk factor for neurodegenerative disease. Nat. Rev. Neurol.15, 565–581 (2019). - PubMed
    1. Jazwinski, S. M. & Kim, S. Examination of the dimensions of biological age. Front. Genet.10, 263 (2019). - PMC - PubMed
    1. Han, J.-D. J. The ticking of aging clocks. Trends Endocrinol. Metab.35, 11–22 (2024). - PubMed

MeSH terms