. 2025 Apr;26(4):619-634.
doi: 10.1038/s41590-025-02100-2. Epub 2025 Mar 5.

A critical role of N4-acetylation of cytidine in mRNA by NAT10 in T cell expansion and antiviral immunity

Affiliations

A critical role of N4-acetylation of cytidine in mRNA by NAT10 in T cell expansion and antiviral immunity

Lu Sun et al. Nat Immunol. 2025 Apr.

Abstract

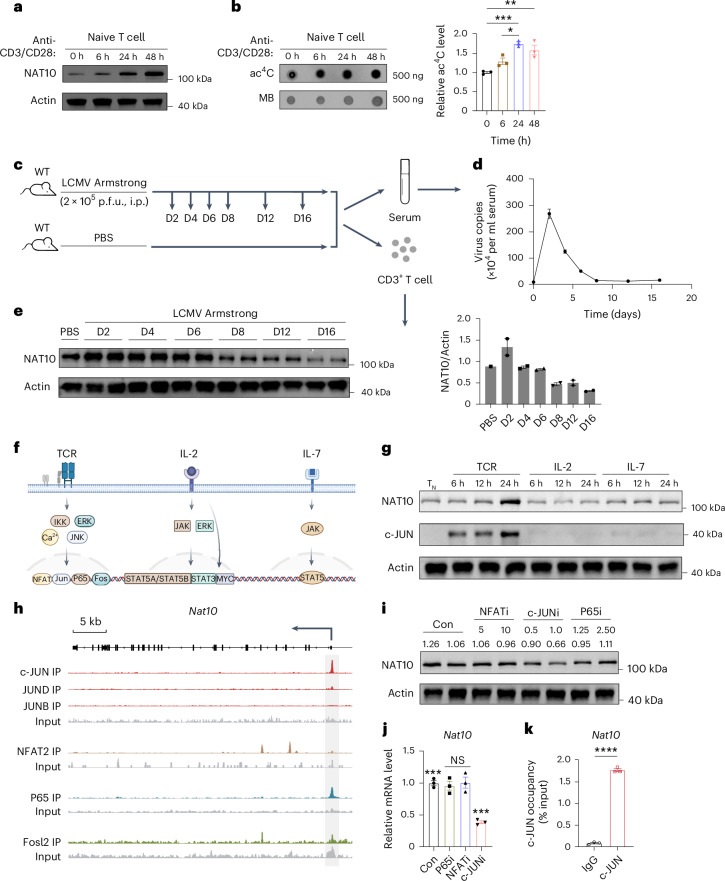
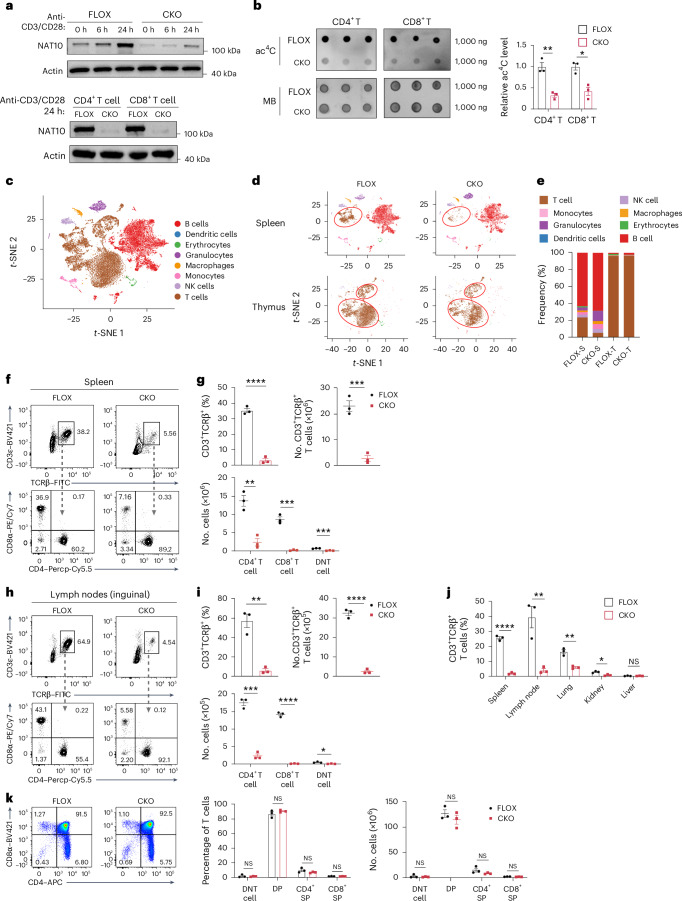
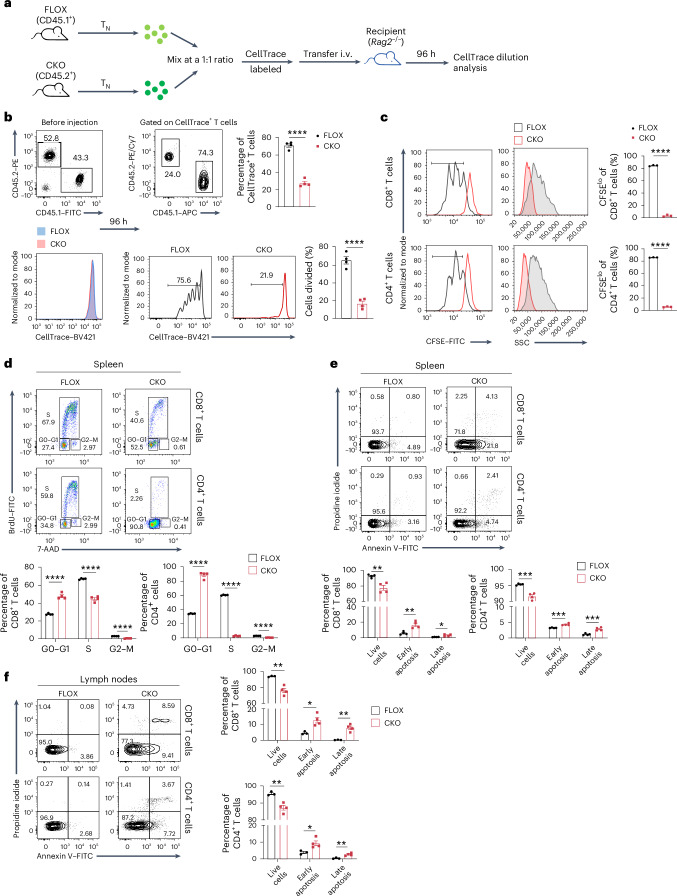
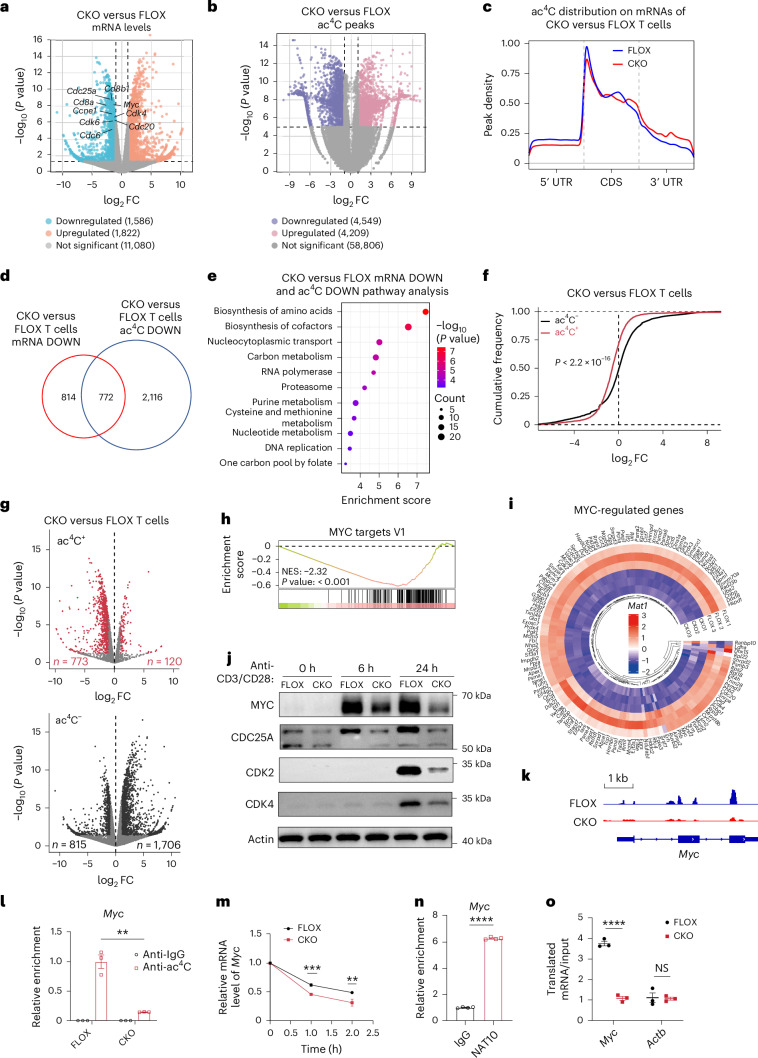
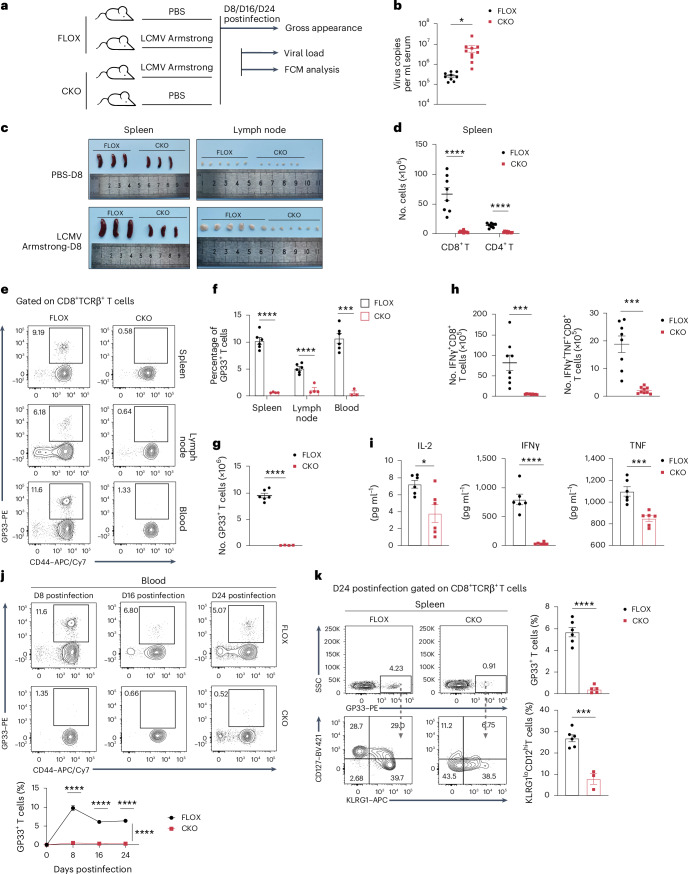
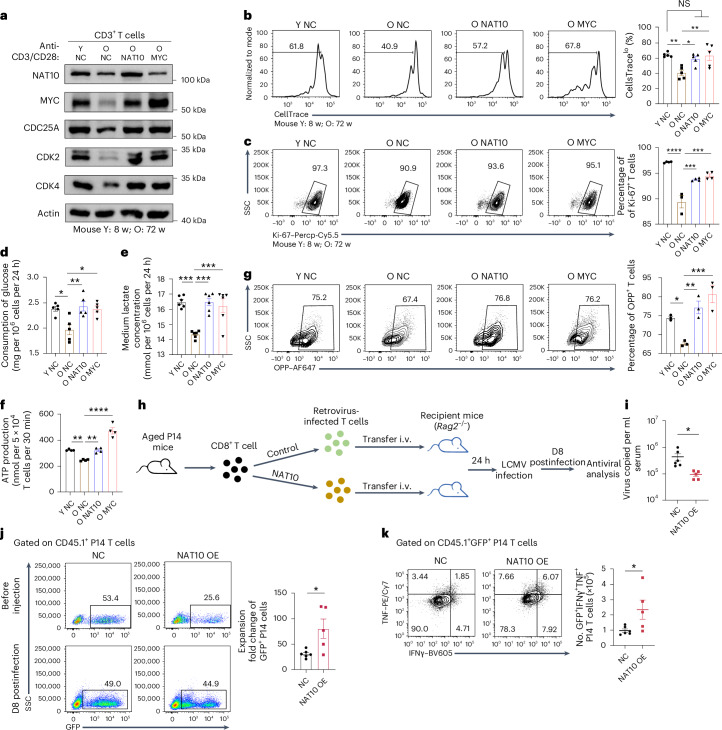
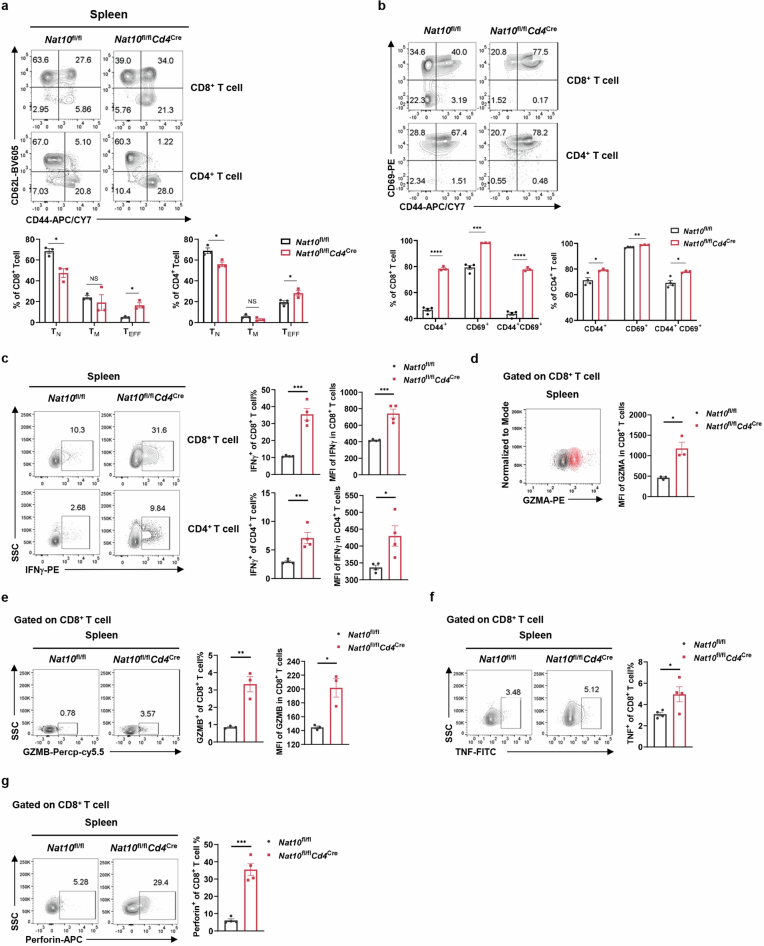
Following activation, naive T cells exit quiescence and require global translation for rapid expansion, yet the underlying mechanisms remain unclear. Here, we show that during T cell activation, cells upregulate the expression of N-acetyltransferase 10 (NAT10), an enzyme responsible for N4-acetylcytidine (ac4C) modification of mRNAs. ac4C-modified Myc mRNAs show higher translation efficiency, enabling rapid synthesis of MYC protein and supporting robust T cell expansion. Conditional deletion of Nat10 in mouse T cells causes severe cell cycle arrest and limitation of cell expansion due to MYC deficiency, ultimately exacerbating infection in an acute lymphocytic choriomeningitis virus model. Additionally, T cells from older individuals with lower NAT10 levels show proliferative defects, which may partially account for impaired antiviral responses in older individuals. This study reveals a mechanism governing T cell expansion, signal-dependent mRNA degradation induction and the potential in vivo biological significance of ac4C modification in T cell-mediated immune responses.


Conflict of interest statement

Competing interests: The authors declare no competing interests.

Figures

Fig. 1
Fig. 1. NAT10 is upregulated during T cell activation.
a, NAT10 expression in CD3+ TN cells stimulated with anti-CD3/CD28 for the indicated lengths of time. b, Dot blot and densitometry analysis of ac4C modifications in total RNA (500 ng) of CD3+ TN cells stimulated with anti-CD3/CD28 for the indicated lengths of time. Left, representative anti-ac4C dot blot. Right, bar graph showing the relative ac4C intensities normalized to total RNA quantified by methylene blue; n = 3; *P = 0.0153, **P = 0.0039 and ***P = 0.0007. c, Schematic of the acute LCMV infection model in WT mice. Eight-week-old WT mice were intraperitoneally injected with 2 × 105 p.f.u. LCMV (Armstrong strain) and killed at 2, 4, 6, 8, 12 and 16 days after infection. Mice treated with equal volumes of PBS served as controls. Serum RNA and CD3+ T cells were isolated for further analysis; D, day; i.p., intraperitoneal. d, Changes in serum viral load during infection; n = 3. e, Western blot and densitometry analysis of NAT10 protein expression in T cells of LCMV Armstrong-infected mice at the indicated times. Each blot represents an independent biological sample. f, Schematic diagram of TCR, IL-2 and IL-7 signaling pathways during T cell activation. Image created using BioRender. g, NAT10 and c-JUN expression in CD3+ TN cells stimulated with TCR (anti-CD3/CD28), IL-2 and IL-7 for the indicated lengths of time. h, IGV snapshots showing c-JUN, JUND, JUNB, NFAT2, P65 and FOSL2 binding sites at the Nat10 locus. The arrow indicates the start site and transcription direction. i, NAT10 expression in CD3+ TN cells stimulated with anti-CD3/CD28 for 24 h in the presence of NFAT inhibitor (NFATi), c-JUN inhibitor (c-JUNi), P65 inhibitor (P65i) and an equal volume of DMSO at the indicated concentrations (in μM), respectively. j, Nat10 expression at the transcriptional level under the same conditions as in i; n = 3. The following are the exact P values from left to right: ***P = 0.0004, ***P = 0.0007, ***P = 0.0004 and not significant (NS), P > 0.05; Con, control. k, c-JUN ChIP–qPCR for the Nat10 locus in CD3+ TN cells stimulated with anti-CD3/CD28 for 24 h; n = 3; ****P < 0.0001. n refers to the number of biologically independent samples. Error bars represent mean ± s.e.m. (b, d, e, j and k). Representative data of three independent experiments are presented (a, b, d, e, g and i). Data were analyzed by two-tailed, one-way analysis of variance (ANOVA) with Tukey’s multiple comparisons test (b and j) and two-tailed, unpaired t-test (k). Source data
Fig. 2
Fig. 2. NAT10 helps to maintain the pool of T cells.
a, NAT10 protein expression in CD3+ TN cells stimulated with anti-CD3/CD28 for the indicated lengths of time (top) or CD4+ and CD8+ TN cells stimulated for 24 h from FLOX and CKO mice (bottom). b, Dot blot and densitometry analysis of ac4C modifications in total RNA (1,000 ng) from CD4+ and CD8+ TN cells stimulated with anti-CD3/CD28 for 24 h. Left, representative anti-ac4C dot blot. Right, bar graph showing the relative ac4C intensities quantified by methylene blue; n = 3; **P = 0.0037 and *P = 0.0103. c, Comprehensive t-SNE visualization of splenic and thymic single cells from 6- to 8-week-old FLOX and CKO mice by cell type; NK, natural killer. d, Separate displays of c by different group, with the same color coding. e, Bar plot showing the percentages of each cluster across groups; related to d; S, splenic; T, thymic. f, Representative FCM plots of splenic CD3+TCRβ+, CD4+ and CD8+ T cells in 8-week-old FLOX and CKO mice in vivo. g, Percentage of CD3+TCRβ+ T cells and absolute numbers of CD3+TCRβ+, CD4+, CD8+ and double-negative (DN) T cells in the spleens of FLOX and CKO mice; n = 3; ****P < 0.0001, ***PNo.CD3+TCRβ+ = 0.0010, ***PNo.CD8+ = 0.0003, ***PNo. DN = 0.0008 and **P = 0.0031. h, Representative FCM plots of CD3+TCRβ+, CD4+ and CD8+ T cells in inguinal lymph nodes of FLOX and CKO mice. i, Percentage of CD3+TCRβ+ T cells and absolute number of CD3+TCRβ+, CD4+, CD8+ and double-negative T cells in inguinal lymph nodes of FLOX and CKO mice; n = 3; ****P < 0.0001, ***P = 0.0001, **P = 0.0022 and *P = 0.0183. j, Proportions of CD3+TCRβ+ T cells in spleen, lymph node, lung, kidney and liver of FLOX and CKO mice; n = 3. ****P < 0.0001, **PLymph node = 0.0081, **PLung = 0.0022 and *P = 0.0104; NS (not significant), P > 0.05. k, Thymic double-negative, double-positive (DP) and CD4+ and CD8+ single-positive (SP) T cells in FLOX and CKO mice. Left, representative FCM plots. Right, bar graphs showing proportions and absolute numbers of indicated thymic populations in FLOX and CKO mice; n = 3. n refers to the number of biologically independent samples. Error bars represent mean ± s.e.m. (b, g and ik). Representative data of three independent experiments are presented (a). Data were analyzed by two-tailed, unpaired t-test (b, g and ik). Source data
Fig. 3
Fig. 3. Loss of NAT10 causes impaired T cell proliferation and enhanced apoptosis.
a, Schematic showing the in vivo competitive proliferation assays. TN cells isolated from 8-week-old CD45.1+ FLOX and CD45.2+ CKO mice were labeled with CellTrace, mixed at a 1:1 ratio and transferred into 8-week-old Rag2−/− mice. After 96 h, CellTrace dilution analysis was performed; i.v., intravenous. b, Proportions and CellTrace fluorescence of CD45.1+ FLOX and CD45.2+ CKO T cells before and 96 h after transfer. Left, representative flow plots. Top right, bar graphs showing the percentages of FLOX and CKO T cells. Bottom right, bar graphs showing the percentages of FLOX and CKO T cells divided more than once; n = 4; ****P < 0.0001. c, Left, representative plots of CFSE staining and side scatters (SSC) of 72-h, anti-CD3/CD28-stimulated FLOX and CKO T cells. Right, bar graphs showing the percentages of CFSElo FLOX and CKO T cells after 72 h of stimulation; n = 3; ****P < 0.0001. d, Cell cycle analysis by BrdU/7-AAD staining of 48-h, anti-CD3/CD28-stimulated CD4+ and CD8+ T cells. Top, representative flow plots. Bottom, bar graphs showing the distribution of FLOX and CKO T cells across G0–G1, S and G2–M phases, respectively. n = 4; ****P < 0.0001. e, Apoptosis assessment by Annexin V/propidium iodide (PI) staining of FLOX and CKO T cells in the spleen. Top, representative flow plots. Bottom, bar graphs showing the proportions of live (Annexin VPI), early apoptotic (Annexin V+PI) and late apoptotic (Annexin V+PI+) splenic T cells in FLOX and CKO mice; n = 4. Exact P values from left to right: **P = 0.0041, **P = 0.0040, *P = 0.0197, ***P = 0.0004, ***P = 0.0006 and ***P = 0.0009. f, Apoptosis detection performed the same as in e in the lymph nodes. Left, representative flow plots. Right, bar charts showing the proportions of the indicated populations in FLOX and CKO mice (FLOX n = 3, CKO n = 4). Exact P values from left to right: **P = 0.0031, *P = 0.0137, **P = 0.0021, **P = 0.0050, *P = 0.0293 and **P = 0.0053. n refers to the number of biologically independent samples. Error bars represent mean ± s.e.m. (bf). Data were analyzed by two-tailed, unpaired t-test (bf). Source data
Fig. 4
Fig. 4. NAT10 is required for the stability and translation efficiency of Myc mRNA.
a, Volcano plot showing differentially expressed genes between CKO and FLOX activated TEFF cells, with cutoffs of P ≤ 0.05 and | fold change | ≥ 2; FC, fold change. b, Volcano plot showing differentially acetylated peaks between CKO and FLOX TEFF cells, with cutoffs of P ≤ 0.00001 and | fold change | ≥ 2. c, Metagene analysis of ac4C sites identified on mRNAs from FLOX and CKO TEFF cells; UTR, untranslated region; CDS, coding sequence. d, Venn diagram showing the numbers of transcriptionally repressed transcripts with significantly fewer modified by ac4C. e, KEGG pathway analysis of the overlapped genes identified in d. f, Cumulative distribution function plot exhibiting differential expression of ac4C+ or ac4C transcripts between CKO and FLOX TEFF cells. g, Volcano plots of differentially expressed mRNAs between CKO and FLOX TEFF cells segregated by ac4C modification, with cutoffs of P ≤ 0.05 and | fold change | ≥ 2. h, GSEA of ‘MYC targets V1’ between CKO and FLOX TEFF cells; NES, normalized enrichment score. i, Circular heat map showing mRNA levels of MYC-regulated genes in FLOX and CKO TEFF cells. j, MYC, CDC25A, CDK2 and CDK4 protein levels in FLOX and CKO CD3+ TN cells stimulated with anti-CD3/CD28 for the indicated lengths of time. Representative bands of three independent experiments are presented. k, IGV plot displaying specific ac4C peaks on Myc transcripts. Peaks are represented as subtracted read densities (IP minus input). l, ac4C RIP–qPCR for Myc mRNA in activated FLOX and CKO CD3+T cells; n = 3; **P = 0.0017. m, Degradation of Myc mRNA in activated FLOX and CKO CD3+ T cells 1 and 2 h after actinomycin D treatment; n = 3; ***P = 0.0003 and **P = 0.0097. n, NAT10 RIP–qPCR for Myc mRNA in activated CKO and FLOX CD3+ T cells; n = 4; ****P < 0.0001. o, Ribosome occupancy of Myc and control mRNAs in activated CKO and FLOX CD3+ T cells; n = 3; ****P < 0.0001. n refers to biologically independent samples. Activated T cells were stimulated with anti-CD3/CD28 for 24 h in lo. Error bars represent mean ± s.e.m. (lo). Data were analyzed by two-tailed, negative binomial distribution test (a, b and g); one-sided, hypergeometric test (Benjamini–Hochberg adjusted) (e); two-tailed, Mann–Whitney U-test (f); two-tailed Kolmogorov–Smirnov test (h) and two-tailed, unpaired t-test (lo). Source data
Fig. 5
Fig. 5. NAT10 overexpression rescues proliferative defects in CKO T cells.
a, Schematic diagram showing construction of bone marrow chimeric mice. CD117+ enriched HSCs from 8-week-old FLOX and CKO mice were infected with control or NAT10- or MYC-overexpressing retrovirus and then transplanted into irradiated 8-week-old CD45.1+ mice. Ten weeks later, CD45.2+ T cells derived from retrovirus-infected HSCs were identified for further proliferation analysis. b, NAT10 and MYC overexpression in CKO T cells was verified by immunoblotting. Representative bands of three independent experiments are presented; NC, negative controls. c, Frequency of CD4+ and CD8+ T cells as a proportion of total adoptive cells identified by CD45.2 staining in each group. Left, representative flow plots. Right, bar graphs showing the percentage of CD4+ and CD8+ T cells from total adoptive cells; n = 3. For data from the spleen, ***PCD8+ = 0.0002, **PCD8+ = 0.0015, *PCD8+ = 0.0488, **PCD4+ = 0.0037 and *PCD4+ = 0.0174. For data from the lymph nodes, ****P < 0.0001, ***P = 0.0005 and **P = 0.0041. d,e, CellTrace dilution analysis of T cells from chimeric mice. T cells labeled by CellTrace were activated with anti-CD3/CD28 for 72 h and detected via FCM. Representative flow plots are shown on the top (d) or left (e), and bar plots displaying percentages of CellTracelo activated T cells in each group are shown on the bottom (d) or right (e); n = 4; ****P < 0.0001. f, O-propargyl-puromycin (OPP) staining of activated T cells (stimulated with anti-CD3/CD28 for 24 h) from chimeric mice. Left, representative flow plots. Right, bar plots displaying the percentages of OPP+ T cells in each group; n = 3; ****P < 0.0001. n refers to the number of biologically independent samples. Error bars represent mean ± s.e.m. (cf). Data were analyzed by two-tailed, one-way ANOVA with Tukey’s multiple comparisons test (cf). Source data
Fig. 6
Fig. 6. NAT10 matters in T cell antiviral immunity.
a, Schematic of the acute LCMV infection model in FLOX and CKO mice. Eight-week-old FLOX and CKO mice were intraperitoneally injected with 2 × 105 p.f.u. LCMV Armstrong and killed at 8, 16 and 24 days after infection. Animals treated with equal volumes of PBS served as blank controls. Serum, spleens and lymph nodes from the LCMV group were collected for further analysis. b, Viral loads in the serum derived from FLOX (n = 9) and CKO (n = 10) mice at 8 days after LCMV administration; *P = 0.0253. c, Gross appearance of spleens and inguinal lymph nodes from infected FLOX and CKO mice and their blank controls at 8 days after PBS or virus administration. d, Absolute number of splenic CD8+ and CD4+ T cells in FLOX (n = 8) and CKO (n = 10) infected mice at 8 days after infection; ****P < 0.0001. e,f, Percentages of GP33+CD44+ CD8+ T cells in the spleen, lymph node and blood from FLOX (n = 6, 6 and 6) and CKO (n = 4, 4 and 3) infected mice at 8 days after infection; ****P < 0.0001 and ***P = 0001. g, Absolute number of splenic GP33+CD44+ CD8+ T cells from FLOX (n = 6) and CKO (n = 4) infected mice at 8 days after infection; ****P < 0.0001. h, Absolute number of splenic IFNγ+ and IFNγ+TNF+ CD8+ T cells in FLOX (n = 8) and CKO (n = 9) infected mice at 8 days after infection; ****P < 0.0001 and ***P = 0.0006. i, Serum IL-2, IFNγ and TNF (8, 4 and 4 days after infection, respectively) levels in FLOX and CKO infected mice (n = 6); ****P < 0.0001, ***P = 0.0007 and *P = 0.0141. j, Percentages of GP33+CD44+ CD8+ T cells in blood from FLOX (n = 5, 6 and 6) and CKO (n = 3, 5 and 5) infected mice at 8, 16 and 24 days after infection; ****P < 0.0001. k, Percentages of GP33+ CD8+ T cells (FLOX n = 6, CKO n = 5) and KLRG1loCD127hiGP33+ CD8+ T cells (FLOX n = 6, CKO n = 3) from FLOX and CKO infected mice at 24 days after infection; ****P < 0.0001 and ***P = 0.0003. n refers to the number of biologically independent samples. Error bars represent mean ± s.e.m. (b, d and fk). Data were analyzed by two-tailed, unpaired t-test (b, d, fi and k) or two-tailed, two-way ANOVA with Šídák’s multiple comparisons test (j). Source data
Fig. 7
Fig. 7. Decreased NAT10 levels in T cells from older individuals might be involved in age-related antiviral defects.
a,b, NAT10 protein (a) and ac4C (b) levels in splenocytes from young (8 weeks (8w)) and old (72 weeks (72w)) mice. The bar graph in b shows the relative ac4C intensities normalized to total RNA (200 ng); n = 3; **P = 0.0034. c, NAT10 and MYC expression levels in CD3+ T cells from young (8 weeks) and old (72 weeks) mice stimulated with anti-CD3/CD28 for the indicated lengths of time. d, CellTrace dilution of 72-h, anti-CD3/CD28-stimulated T cells from young (8 weeks) and old (72 weeks) mice. Left, representative flow plots. Right, bar graphs showing percentages of CellTraceloCD3+ T cells from young and old mice, respectively; n = 3; **P = 0.0088. e, NAT10 and MYC protein levels in 48-h, anti-CD3/CD28-stimulated PBMCs from healthy young (<60 years old, three men and two women) and older (≥60 years old, three men and two women) adults. f, CFSE dilution of 72-h, anti-CD3/CD28-stimulated CD3+ T cells from young (<60 years old) and older (≥60 years old) healthy donors. Left, representative flow plots. Right, bar graphs showing percentages of CFSEloCD3+ T cells in young (n = 5) and older (n = 4) healthy donors; *P = 0.0218. g,h, Box plots showing NAT10 and MYC expression between none-severe and severe groups of the same age category (g) or between young (<60 years old) and older (≥60 years old) groups with similar disease severity (h; young none-severe n = 26, young severe n = 16, old none-severe n = 23, old severe n = 33). Boxes show median and top and bottom quartiles, whiskers show 1.5× interquartile range on either side, and points show independent samples. i, Correlation analysis between NAT10 and MYC expression in individuals with COVID-19; n = 98. j, Correlation analysis between APACHEII scores and NAT10 and MYC expression in individuals with COVID-19; n = 56. k, NAT10 expression across clusters identified in Extended Data Fig. 6i. l, Proportions of CD8+ proliferating T cells in young none-severe (n = 14), old none-severe (n = 4), young severe (n = 8) and old severe (n = 5) individuals, respectively. n refers to the number of biologically independent samples. Representative data from three independent experiments are presented (c and e). Error bars represent mean ± s.e.m. (b, d and f). Data were analyzed by two-tailed, unpaired t-test (b, d, fh and l) or two-tailed, Pearson correlation method (i and j); TCM, central memory T cell; MAIT, mucosal-associated invariant T cells; Treg, regulatory T cells; TEM, effector memory T cells; CTL, cytotoxic T lymphocytes. Source data
Fig. 8
Fig. 8. NAT10 overexpression restores proliferation and antiviral defects in T cells from older animals.
a, NAT10 and MYC overexpression in T cells from aged mice. Representative data from three independent experiments are shown. Y, young; O, old; w, weeks. b,c, CellTrace dilution analysis (b) and Ki-67 expression (c) in T cells from aged mice with NAT10 or MYC overexpression. Left, representative flow plots. Right, bar diagrams showing the percentage of CellTracelo (b) or Ki-67+ (c) T cells in each group; n = 5 (b) and n = 4, 3, 4 and 4 (c). Exact P values from left to right: **P = 0.0052, *P = 0.0315 and **P = 0.0065 (b) and ****P < 0.0001, ***P = 0.0005 and ***P = 0.0001 (c). df, Glucose consumption (d), lactate production (e) and ATP generation (f) in T cells from aged mice with NAT10 or MYC overexpression; n = 5, 6 and 4. Exact P values from left to right: *P = 0.0115, **P = 0.0048 and *P = 0.0122 (d), ***P = 0.0001, ***P = 0.0001 and ***P = 0.0006 (e) and **P = 0.0081, **P = 0.0086 and ****P < 0.0001 (f). g, OPP staining of T cells from aged mice with NAT10 or MYC overexpression. Left, representative flow plots. Right, bar diagrams showing the percentage of OPP+ T cells in each group; n = 3; ***P = 0.0010, **P = 0.0073 and *P = 0.0428. h, Flow chart of experiments exploring the impact of NAT10 restoration on T cell antiviral potency. CD8+ T cells from old P14 mice with control or Nat10-overexpressing plasmids were transferred into 8-week-old Rag2−/− mice 1 day before LCMV infection. Eight days later, antiviral analysis was performed. i, Serum viral loads of recipients at 8 days after LCMV infection; NC n = 6, Nat10 overexpression (OE) n = 5; *P = 0.0424. j, Proportions of GFP+ P14 T cells in recipients. Left, representative flow plots. Right, bar diagrams showing the expansion fold changes of GFP+ P14 T cells in each group; NC n = 6, Nat10 overexpression n = 5; *P = 0.0195. k, Detection of IFNγ+TNF+GFP+ CD8+ T cells in recipients. Left, representative flow plots. Right, bar diagrams showing the absolute number of splenic IFNγ+TNF+GFP+ CD8+ T cells in the two groups; NC n = 6, Nat10 overexpression n = 5; *P = 0.0415. n refers to the number of biologically independent samples. Error bars represent mean ± s.e.m. (bg and ik). Data were analyzed by two-tailed, one-way ANOVA with a Tukey’s multiple comparisons test (bg) or two-tailed, unpaired t-test (ik). Source data
Extended Data Fig. 1
Extended Data Fig. 1. NAT10 helps to maintain the pool of T cells.
a tSNE visualization of splenic and thymic single cells from FLOX and CKO mice by clusters. b Table listing the exact percentage of cells from FLOX or CKO mice as a fraction of total T cells for each cluster, corresponding to the bar plot in Fig. 2e. c UMAP visualization of splenic T cells from FLOX and CKO mice identified in Fig. 2d. d Bar plot showing the percentage of cells from FLOX or CKO mice as a fraction of total T cells for each cluster, related to the UMAP plot in (c). e Bubble plot exhibiting the top 8 up-regulated (left) and 10 down-regulated (right) transcripts of CKO versus FLOX splenic T cells. Populations marked by blue and red block represent T cells from FLOX and CKO mice, respectively. f Bar graph showing the geometric mean fluorescence intensity (MFI) of CD8α and CD8β1 in FLOX and CKO CD8+T cells. Error bars represent mean ± s.e.m. n = 3 biologically independent samples. **P = 0.0065, *P = 0.0112. Two-tailed, unpaired t-test. Source data
Extended Data Fig. 2
Extended Data Fig. 2. T cell presents hyperactive features after NAT10 deletion.
a The fraction of splenic naive (CD44loCD62Lhi, TN), effector (CD44hiCD62Llo, TEFF) and memory T cells (CD44hiCD62Lhi, TM) were quantified by FCM. Left, representative flow plots. Right, bar graphs showing the percentage of naive, effector, memory T cells in FLOX and CKO mice. n = 3. Exact P values from left to right: *P = 0.0124, *P = 0.0101, *P = 0.0221, *P = 0.0474, NS, P > 0.05. b T cell activation measured by CD69 and CD44 staining of activated FLOX and CKO TN with anti-CD3/28 stimulation for 24 h. Left, representative flow plots. Right, bar plots showing the percentage of CD44+, CD69+ and CD44+CD69+ T cells in FLOX and CKO CD8+ and CD4+ T cells, respectively. FLOX n = 4, CKO n = 3. Exact P values from left to right: ****P < 0.0001, ***P = 0.0002, *P = 0.0259, **P = 0.0028, *P = 0.0128. c Expression of IFNγ in FLOX and CKO T cells measured by FCM. Left, representative flow plots. Right, bar graphs showing IFNg+ fraction as well as IFNγ MFI in FLOX and CKO splenic T cells. n = 4. ***P (CD8+T IFNγ MFI) = 0.0009, ***P (CD8+ IFNγ+T%) = 0.0004, **P = 0.0056, *P = 0.024. d Expression of GZMA in CD8+ FLOX and CKO T cells measured by FCM. Left, representative flow plots. Right, bar graphs showing GZMA+ fraction and GZMA MFI of CD8+ FLOX and CKO T cells. n = 3. *P = 0.0100. e Expression of GZMB in CD8+ FLOX and CKO T cells measured by FCM. Left, representative flow plots. Right, bar graphs showing GZMB+ fraction and GZMB MFI of CD8+ FLOX and CKO T cells. n = 3. **P = 0.0050; *P = 0.0138. f Expression of TNF in CD8+ FLOX and CKO T cells measured by FCM. Left, representative flow plots. Right, bar graphs showing TNF+ fraction and TNF MFI of CD8+ FLOX and CKO T cells. n = 4. *P = 0.0433. g Expression of perforin in CD8+ FLOX and CKO T cells measured by FCM. Left, representative flow plots. Right, bar graphs showing the percentage of perforin+ CD8+ FLOX and CKO T cells. n = 4. ***P = 0.0002. The values of “n” all refer to biologically independent samples. Error bars represent mean ± s.e.m. (ag). Two-tailed, unpaired t-test (ag). Source data
Extended Data Fig. 3
Extended Data Fig. 3. NAT10 is required for the stability and translation efficiency of Myc mRNA.
a Gene Ontology (GO) enrichment analysis of down-regulated genes in CKO T cells compared to their FLOX controls. Biological process terms were displayed. b KEGG pathway analysis of mRNAs with lower ac4C levels in CKO T cells compared to their FLOX controls. c GSEA plots showing significantly enriched gene sets, “DNA replication”, “G1 S transition” and “Positive regulation of cell cycle”. d Cumulative distribution plots of translation efficiency (TE) for ac4C (−)/(+) transcripts in FLOX CD3+ T cells (upper left), and ac4C (−) transcripts in FLOX and CKO T cells (upper right). The cumulative distribution plot of TE relative changes (log fold change, CKO VS FLOX) for ac4C (−) and ac4C (+) transcripts was also displayed (down). Hypergeometric test, one-sided, BH adjusted (a, b), two-tailed Kolmogorov–Smirnov test (c) and two-tailed Mann-Whitney U test (d). Source data
Extended Data Fig. 4
Extended Data Fig. 4. NAT10 deletion causes metabolic dysfunction of T cells.
a Heatmap summarizing expressions of critical genes in glutaminolysis, glycolysis, amino acids biosynthesis and nucleotide metabolism in CKO versus FLOX TEFF cells from RNA-seq data (related to Fig. 4a). Expression data was Z-score normalized. b Differential activity of indicated metabolic reactions between FLOX and CKO splenic T cells calculated via “Compass” algorithm based on scRNA-seq data. Effect size was assessed with Cohen’s d statistic, namely absolute difference in means divided by the pooled SD. c, d TN were purified from 8-week-old FLOX and CKO mice, part of which were stimulated with anti-CD3/28 for 24 h. Then, FLOX TN, CKO TN as well as their activated counterparts were subjected to metabolic profiling. Heatmap of nucleotide profiles (c), metabolite profiles (d) in FLOX TN, FLOX TEFF, CKO TN and CKO TEFF were presented. Data was Z-score normalized. e TN were purified from 8-week-old FLOX and CKO mice and stimulated with anti-CD3/28 for 24 h. Glucose uptake measured by 2-NBDG fluorescence intensity through FCM was displayed. FLOX n = 5, CKO n = 6. ****P < 0.0001. f Relative ECAR and OCR of FLOX and CKO TN measured at baseline or with anti-CD3/CD28 beads stimulation. For ECAR, FLOX-TN n = 10, CKO-TN n = 9, FLOX-CD3/28 n = 7, CKO-CD3/28 n = 8; ***P (interaction) = 0.0006, P (*marked timepoint) = 0.0092, 0.0081, 0.0022, 0.0043, 0.0051, 0.0096, 0.0020, 0.0043, respectively. For OCR, FLOX-TN n = 9, CKO-TN n = 3, FLOX-CD3/28 n = 5, CKO-CD3/28 n = 4; **P (interaction) = 0.0090, P (*marked timepoint) = 0.0422, 0.0135, 0.0070, 0.0056, 0.0270, 0.0193, 0.0098, 0.0017, respectively. g TN were purified from 8-week-old FLOX and CKO mice, part of which were stimulated with anti-CD3/28 for 24 h. Then, ATP production of FLOX-TN (n = 6), CKO-TN (n = 5) as well as their activated counterparts (n = 5) were measured. **P = 0.0016, ****P < 0.0001. The values of “n” all refer to biologically independent samples. Error bars represent mean ± s.e.m. (eg). Two tailed, negative binomial distribution test (e); two-tailed, two-way ANOVA with Šídák’s multiple comparisons test (f); two-tailed, one-way ANOVA with Tukey’s multiple comparisons test (g). Source data
Extended Data Fig. 5
Extended Data Fig. 5. NAT10 knockdown compromised proliferative potency of P14 T cells in response to LCMV infection.
a Schematic diagram of in vivo experiments to explore the role of NAT10 in specific-antiviral response of P14 T cells. CD45.1+ CD8+ P14 T cells were isolated, labeled with CFSE, and then infected by retrovirus containing LMP-NC and LMP-Nat10-shRNA plasmids, respectively. Equal amounts of these T cells (4 × 105 cells) were then i.v. injected into 8-week-old CD45.2+ recipient mice 1 day before Armstrong infection. 3 or 7 days later, the recipients were sacrificed for proliferation analysis. b Knockdown efficiency of NAT10 was assessed by western blot analysis. Representative data of three independent experiments is presented. c CFSE dilution analysis before injection and 72 h after LCMV infection. Left, representative flow plots. Right, bar graphs showing percentages of CFSElo P14 T cells in the 2 groups, respectively. n = 4, ****P < 0.0001. d Proportion of retrovirally infected P14 T cells identified by AmCyan fluorescence. Left, representative flow plots. Right, bar diagrams showing the percentage, absolute number and expansion folds of AmCyan+ P14 T cells in each group. n = 4, ****P < 0.0001, ***P (#AmCyan+ P14 T cell) = 0.0003, ***P (Expansion foldchange) = 0.0003. e Detection of IFNγ+ TNF+ AmCyan+ P14 T cells in recipients with control or NAT10 KD P14 T cells adaptive transfer, respectively. Up, representative flow plots. Down, bar diagrams exhibiting percentages and absolute number of splenic IFNγ+ TNF+ AmCyan+ P14 T cells in the two groups. n = 4. ****P < 0.0001. The values of “n” all refer to biologically independent samples. Error bars represent mean ± s.e.m. (ce). Two-tailed, unpaired t-test (ce). Source data
Extended Data Fig. 6
Extended Data Fig. 6. Exploration of reduced NAT10 levels in immune senescence.
a Schematic diagram of RNA-seq and ac4C-RIP-seq performed on spleen from young (8w) and aged (72w) mice. b GO enrichment analysis of transcripts with less ac4C modification in splenocytes from old mice compared to their young controls. Biological process terms were displayed. c Bar graph showing ac4C peak distribution on mRNAs of splenocytes from young (8w) and old (72w) mouse. d Motif analysis for ac4C peaks in spleen from young (8w) and old (72w) mice. e GO enrichment analysis of the overlapped genes between “Old VS Young mRNA down” (n = 679) and “Old VS Young ac4C down” (n = 1586) genes. Biological process terms were displayed. f Schematic diagram showing isolation and culture procedure of PBMC. g Percentages of CD3+ T cells in PBMC from young (<60 years old) and old (≥60 years old) subjects with anti-CD3/28 stimulation for 48 h. Left, representative flow plots. Right, bar graph displaying the percentage of CD3+T cells after 48h-culture (n = 5 biologically independent samples.). Error bars represent mean ± s.e.m., NS P > 0.05 by two-tailed, unpaired t-test. h UMAP visualization of PBMC from 33 COVID-19 patients and 8 healthy controls according to scRNA-seq data from Wilk, Aaron J et al.. i Deeper UMAP visualization of NK and T cells identified in (h). Hypergeometric test, one-sided, BH adjusted (b, d, e). Icons in Extended Data Fig. 6a, f were from Figdraw (https://www.figdraw.com/) with the agreement ID: RIARO787e2. Source data
Extended Data Fig. 7
Extended Data Fig. 7. Gating strategies.
Representative flow cytometry gating strategies for main T cell subsets (a), in vitro (b) and in vivo (c) CellTrace or CFSE dilution in T cells. Gating strategies used for identifying T cells with plasmids successfully transformed were displayed in (d) and (e). T cells deriving from transferred HSCs in chemic mice were showed in (f). Source data

References

    1. Wolf, T. et al. Dynamics in protein translation sustaining T cell preparedness. Nat. Immunol.21, 927–937 (2020). - PMC - PubMed
    1. Larrieu, D. et al. Inhibition of the acetyltransferase NAT10 normalizes progeric and aging cells by rebalancing the transportin-1 nuclear import pathway. Sci. Signal.11, eaar5401 (2018). - PMC - PubMed
    1. Tsai, K. et al. Acetylation of cytidine residues boosts HIV-1 gene expression by increasing viral RNA stability. Cell Host Microbe28, 306–312 (2020). - PMC - PubMed
    1. Guo, G. et al. Epitranscriptomic N4-acetylcytidine profiling in CD4+ T cells of systemic lupus erythematosus. Front. Cell Dev. Biol.8, 842 (2020). - PMC - PubMed
    1. Wang, K. et al. PIWI-interacting RNA HAAPIR regulates cardiomyocyte death after myocardial infarction by promoting NAT10-mediated ac4C acetylation of Tfec mRNA. Adv. Sci.9, e2106058 (2022). - PMC - PubMed

MeSH terms

LinkOut - more resources