. 2025 May;7(5):918-927.
doi: 10.1038/s42255-025-01245-6. Epub 2025 Mar 5.

Asparagine deprivation enhances T cell antitumour response in patients via ROS-mediated metabolic and signal adaptations

Affiliations

Asparagine deprivation enhances T cell antitumour response in patients via ROS-mediated metabolic and signal adaptations

Hsuan-Chia Chang et al. Nat Metab. 2025 May.

Abstract

Preclinical studies have shown that asparagine deprivation enhances T cell antitumour responses. Here we apply compassionate use of L-asparaginase, usually employed to treat blood malignancies, on patients with recurrent metastatic nasopharyngeal carcinoma. The use of L-asparaginase notably enhances immune-checkpoint blockade therapy in patients by strengthening CD8+T cell fitness. Our study shows that this combination is a promising avenue for clinical application and provides further mechanistic insight into how asparagine restriction rewires T cell metabolism.


Conflict of interest statement

Competing interests: P.-C.H. is a co-founder of Pilatus Biosciences and serves as scientific advisor board member for Pilatus Biosciences, Celyad Oncology and Elixiron Immunotherapeutics. The other authors declare no competing interests.

Figures
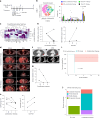
Fig. 1
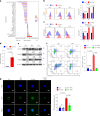
Fig. 1. Asparaginase boost PD-1 blockade-induced antitumour immunity.
a, Schematic diagram illustrating the design of a clinical trial for patients with NPC. IM QD, intramuscularly once a day; l-ASP, l-asparaginase. b, t-distributed stochastic neighbour embedding (t-SNE) analysis of CD3+CD8+T cells from peripheral blood mononuclear cell (PBMC) populations (n = 8) identifies distinct clusters of T cells. Percentage of CD3+CD8+T cells from different days in each FlowSOM cluster. c, FlowSOM clusters, with a heat map of effector molecule mean fluorescence intensity (MFI) overlaid onto the t-SNE analysis. d, PET images of representative patients from the combination therapy group (n = 4) and anti-PD-1 monotherapy group (n = 2) before and after treatment. e, Changes in maximum SUV (SUVmax) in tumours following treatment. f, CT scans of two representative patients before and after combination therapy. Red arrows indicate tumour locations post-treatment. g, Tumour diameter measurements for f over the course of combination therapy (n = 2). h, Plasma EBV relative DNA copy number distribution in patients with metastatic NPC conduct combination therapy (n = 6) and PD-1 therapy (n = 2). i, PFS by treatment group. j, ORR by treatment group. CR, complete response; PD, progressive disease; PR, partial response; PF, progression-free. All data are mean ± s.e.m. and were analysed by one-tailed, paired Student’s t-test (b). NS, not significant. Source data
Fig. 2
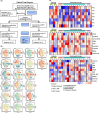
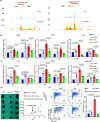
Fig. 2. Asparagine deprivation tailors differentiation and metabolic adaptation in a ROS-dependent manner.
a, The enriched transcription factors (TFs) in both Asn-free and control conditions are selected and the TFs that have the most target region enrichment in either Asn-free or control are represented as the preference. b,c, Naive CD8+T cells were cultured under CD8 differentiation conditions in both control medium and asparagine-deprived medium for various durations. Subsequently, CD8+T cells were stained for DCFDA (b) and MitoSOX (c) (n = 3). d, Lysed cells from a control medium or an asparagine-deprived medium 3-day cultured CD8+ T cell. The cells were subsequently analysed using liquid chromatography–mass spectrometry to assess the GSSG/GSH ratio (n = 3). e, Naive CD8+T cells were cultured under CD8+ differentiation conditions in both control medium and asparagine-deprived medium for various durations. The protein levels of the indicated molecules were determined through immunoblot analysis, which was independently repeated three times. Blots were cropped for clarity. Actin was run on separate gels due to different protein loading amounts. To ensure comparability, all blots were processed in parallel under identical conditions. IB, immunoblot. f, Naive CD8+T cells cultured in CD8+ differentiation conditions with either asparagine-free or control medium and added with 20 mM NAC for 3 days, CD8+ T cells stained for IFNγ and granzyme B and analysed by flow cytometry (n = 3). PE, phycoerythrin; APC, allophycocyanin. g, Imaging of NFAT localization staining (in green) and DAPI (in blue) in CD8+ T cells by confocal microscopy (n = 3). Scale bar, 5 µm. All data are mean ± s.e.m. and were analysed by one-tailed unpaired (d) Student’s t-test, one-way analysis of variance (ANOVA) with two-way ANOVA with Tukey’s multiple comparisons test (f and g) or Sidak multiple comparisons tests with adjusted P value (b and c), and data are cumulative results from three independent experiments. NES, normalized enrichment score. Source data
Extended Data Fig. 1
Extended Data Fig. 1. Immunoprofiling of CD8 + T cells and metabolomics dynamics after therapy.
(A)Flow diagram illustrates the process of patient enrolment, allocation, follow-up, and analysis in the compassionate-use study. A total of nine patients were assessed for eligibility from August 2023 to March 2024. One patient was excluded due to active autoimmune disease, resulting in eight enroled participants. Allocation was based on the patients’ preferences, with six patients opting for combination therapy involving L-asparaginase and anti-PD-1, and two patients opting for anti-PD-1 monotherapy. All participants were followed up, with no losses to follow-up or discontinued interventions. The analysis included flow cytometry, EBV DNA quantification, and PET/CT imaging. (B) t-SNE plots generated using FlowSOM to illustrate the expression levels of various immune markers in Fig. 1b. (C)The metabolomic profiles of patients before and after treatment. Each row represents a metabolite, and each column represents a patient sample (n = 8). The colours indicate the z-score normalized abundance of each metabolite. Source data
Extended Data Fig. 2
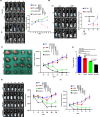
Extended Data Fig. 2. Asparaginase synergize with anti-PD-1 to elevate T cell antitumour responses.
(A) B16-F10-Luc-bearing C57BL/6 and Tcrb KO mice were administered with vehicle or L-asparaginase (5 U/g) three days before tumour inoculation and then 3 times per week by intraperitoneal injection. The average luminescent intensity of photons emitted from each tumour in the images was quantified. Data are presented as mean ± SEM (n = 4 mice per group). (B) B16-OVA-bearing C57BL/6 mice were administered with vehicle or L-asparaginase (5 U/g) or PBS on day 7 after tumour inoculation and received 1.5 × 10^6 activated OTI T cells on day 10. The average luminescent intensity of photons emitted from each tumour in the images was measured. Error bars represent the standard error of the mean (SEM). Data represent one independent experiment (n = 3 mice per group). Error bars indicate SEM. (C) MTCQ1-bearing C57BL/6 were treated with either a vehicle, L-ASP, anti-PD-1, or a combination of L-ASP and anti-PD-1 starting on day 7 after tumour inoculation. The average tumour volume is emitted from each tumour group (left) and final tumour weight at the endpoint of the experiment (right)(n = 4 mice per group). (D) Tumour weight was measured at the end of the experiment. The average tumour volume, luminescent intensity, and tumour weight for each treatment group are shown (n = 4). (E) B16-OVA-bearing C57BL/6 mice were treated with either a vehicle, L-ASP, anti-PD-1, or a combination of L-ASP and anti-PD-1 starting on day 7 after tumour inoculation (n = 4 mice per group). (F) Final tumour weight at the endpoint of the experiment (n = 4 mice per group). All data are mean ± SEM and were analysed by one-tailed unpaired (A, B, E, F) Student’s t-test, Sidak multiple comparisons tests (C) and Tukey’s multiple comparisons test (D) with adjusted P value and data are cumulative results from at least three independent experiments. Source data
Extended Data Fig. 3
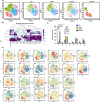
Extended Data Fig. 3. Asparaginase boost PD-1 blockade-induced CD8 + T cell activation.
(A) t-SNE projections of CD45+ CD8+tumour-infiltrating lymphocytes (TILs), derived from tumours under different treatments (Ctrl, L-ASP, Anti-PD-1, and combination therapy). Clusters were identified by FlowSOM clustering, and the percentage of TILs in each cluster across different treatment groups is shown (n = 3). (B) FlowSOM clusters, with a heat map of effector molecule MFIs overlaid onto the t-SNE analysis. (C) Quantification of FlowSOM clusters across treatment groups, presented as the percentage of total Tcrb+ CD45+ CD8+ TILs per cluster. (D) t-SNE projections of selected protein expression from (A), showing the distribution of key markers related to T cell activation, exhaustion, and effector function. All data represent mean ± SEM from at least three independent biological replicates. Two-way ANOVA with Tukey’s multiple comparisons test was used in (C). Source data
Extended Data Fig. 4
Extended Data Fig. 4. Asparagine deprivation enhances CD8 + T cell effector functions.
Naïve CD8 + T cells were isolated from WT B6 mice and cultured under CD8 differentiation conditions using a medium without asparagine (Asn-free) or with 1U/ml asparaginase (L-ASP). (A) After three days of culture, the cells were re-stimulated with PMA and ionomycin for four hours in the presence of Golgistop. CD8 + T cells stained for IFN-γ and granzyme B (n = 3). (B) GSEA tracing for T cell activation in Asn-free and control cultured CD8 + T cell. ES, enrichment score; NES, normalized enrichment score; FDR, false discovery ratio. (C) human CD8 + T cells were isolated from human PBMCs using the Naive CD8 + T Cell Isolation Kit, human. CD8 + T cells cultured under control and asparagine-deprived conditions. After 3 days cultured, cells were then re-stimulated with PMA and ionomycin for 4 h with Golgistop. CD8 + T cells stained for IFN‐γ and granzyme B (n = 3). All data are mean ± SEM and were analysed by one-way ANOVA with Tukey’s multiple comparisons test (A) and two-way ANOVA with Sidak multiple comparisons tests (C) with adjusted P value and data are cumulative results from at least three independent experiments. Source data
Extended Data Fig. 5
Extended Data Fig. 5. Prolonged asparagine deprivation enhances CD8 + T cell differentiation with more superior effector functions.
Naïve CD8 + T cells were isolated from WT B6 mice and cultured under CD8 differentiation conditions using a medium without asparagine (Asn-free). For various durations, the cells were re-stimulated with PMA and ionomycin for four hours in the presence of GolgiStop, permeabilized, and stained for IFN-γ and granzyme B. (A) t-SNE analysis of CD8 + T cells in differentiation conditions using both control medium and asparagine-deprived medium (B) with a heat map of effector molecule MFIs overlaid onto the t-SNE analysis. (C) t-SNE projection of CD8 + T cells for all groups with various durations and percentages of CD8 + T cells from different days in each FlowSOM cluster (n = 3). All data are mean ± SEM and were analysed by two-way ANOVA with Sidak multiple comparisons tests (C) with adjusted P value and data are cumulative results from at least three independent experiments. Source data
Extended Data Fig. 6
Extended Data Fig. 6. Asparagine deprivation reprograms mitochondrial fitness in T cells.
(A) GSEA tracing for mitochondrial biogenesis in Asn-free and control cultured CD8 + T cell. ES, enrichment score; NES, normalized enrichment score; FDR, false discovery ratio. (B) The level of indicated mRNAs in control T cells and asparagine-free T cell were determined by qPCR (n = 3). (C) Naïve CD8 + T cells cultured in asparagine-free and control medium for several days. CD8 + T cells stained with MitoTracker™ Green FM Dye and MitoTracker™, Deep Red FM Dye (n = 3). All data represent mean ± SEM from three independent biological replicates. One-tailed unpaired Student’s t-test was used for individual comparisons in (B), while two-way ANOVA with Šídák’s multiple comparisons test was applied in (C). Source data
Extended Data Fig. 7
Extended Data Fig. 7. Asparagine deprivation influences metabolic preferences in T cells.
(A) Traces of oxygen consumption rates (OCRs) were recorded (n = 3). The following compounds were injected into the assay micro-chambers as indicated: oligomycin (Olig.), carbonyl cyanide 4-(trifluoromethoxy) phenylhydrazone (FCCP), and rotenone plus antimycin A (R + A). (B) Traces of extracellular acidification rates (ECARs) were recorded (n = 3). Compounds injected included glucose (Glc), oligomycin, and 2-deoxy glucose (2DG). Each data point represents the mean ± standard deviation (SD) of four technical replicates. (C) Lysed cells from a control medium or an asparagine-deprived medium 3-day cultured CD8 T cell. The cells were subsequently analysed using liquid chromatography–mass spectrometry (LC–MS) to assess the glycolysis (right) and TCA cycle (left) (n = 3). All data represent mean ± SEM from three independent biological replicates. Two-tailed unpaired Student’s t-test was used for individual comparisons in (C), two-way ANOVA with Sidak multiple comparisons tests (A, B)with adjusted P value and data are cumulative results from at least three independent experiments. Source data
Extended Data Fig. 8
Extended Data Fig. 8. Asparagine deprivation affects glutamine metabolism to enhance CD8 T cell activation.
(A) Lysed cells from a control medium or an asparagine-deprived medium 3-day cultured CD8 T cell. The cells were subsequently analysed using liquid chromatography–mass spectrometry (LC–MS) to assess the glutamine and glutamate (n = 3). (B) GSEA tracing for mitochondrial biogenesis in Asn-free and control cultured CD8 + T cell. ES, enrichment score; NES, normalized enrichment score; FDR, false discovery ratio. (C) The level of indicated mRNAs in control T cells and asparagine-free T cell were determined by qPCR (n = 3). (D) Naïve CD8 + T cells were cultured in CD8 differentiation conditions with either asparagine-free or control medium for three days. For the Asn-free to DF condition (Asparagine and Glutamine-free), after two days of culture in an asparagine-free medium, the cells were transferred to a medium lacking both asparagine and glutamine for one day. CD8 + T cells stained for IFN-γ and granzyme B and analysed by flow cytometry (n = 3). All data represent mean ± SEM from three independent biological replicates. One-tailed unpaired Student’s t-test was used for individual comparisons in (A, C), while one-way ANOVA with Tukey’s multiple comparisons test was applied in (D). P < 0.05 was considered statistically significant. Source data
Extended Data Fig. 9
Extended Data Fig. 9. Asparagine deprivations modulates chromatin accessibility pattern in T cells.
(A) The signal of open chromatin in both Asn-free and control conditions on Day 3 are represented in the genomics locus of IFNG and GZMB. The orange indicated the Asn-free condition whereas the blue indicated the control condition. (B) (C) The level of indicated mRNAs in T cells cultured under control and asparagine-deprived conditions in the presence of N-acetylcysteine (NAC) were determined by qPCR (n = 3). (D) B16-OVA-bearing Tcrb KO mice were received 1.5 × 10^6 activated OTI T cells on day 7. Data are presented as the mean ± SEM (n = 5 for each group). (E) human CD8 + T cells were isolated from human PBMCs using the Naive CD8 + T Cell Isolation Kit, human. CD8 + T cells cultured under control and asparagine-deprived conditions in the presence of N-acetylcysteine (NAC) for 3 days (n = 3). CD8 + T cells were stained for IFN-γ and granzyme B and analysed by flow cytometry (n = 3). All data represent mean ± SEM from three independent biological replicates. One-tailed unpaired Student’s t-test was used for individual comparisons in (B, C, E), while two-way ANOVA with Tukey’s multiple comparisons test was applied in (D). P < 0.05 was considered statistically significant. Source data

References

    1. Wang, Y. et al. Metabolic modulation of immune checkpoints and novel therapeutic strategies in cancer. Semin. Cancer Biol.86, 542–565 (2022). - PubMed
    1. Grywalska, E., Pasiarski, M., Gozdz, S. & Rolinski, J. Immune-checkpoint inhibitors for combating T-cell dysfunction in cancer. Onco. Targets Ther.11, 6505–6524 (2018). - PMC - PubMed
    1. Li, H. et al. Targeting T-cell metabolism to boost immune checkpoint inhibitor therapy. Front. Immunol.13, 1046755 (2022). - PMC - PubMed
    1. Lim, A. R., Rathmell, W. K. & Rathmell, J. C. The tumor microenvironment as a metabolic barrier to effector T cells and immunotherapy. eLife10.7554/eLife.55185 (2020). - PMC - PubMed
    1. Li, X. et al. Navigating metabolic pathways to enhance antitumour immunity and immunotherapy. Nat. Rev. Clin. Oncol.16, 425–441 (2019). - PubMed

MeSH terms

LinkOut - more resources