

A one-week reduced-carbohydrate diet to mitigate iatrogenic peripheral hyperinsulinemia does not improve insulin sensitivity or endothelial function in a randomized, crossover trial in patients with type 1 diabetes
- PMID: 40045281
- PMCID: PMC11884211
- DOI: 10.1186/s12933-025-02658-z
A one-week reduced-carbohydrate diet to mitigate iatrogenic peripheral hyperinsulinemia does not improve insulin sensitivity or endothelial function in a randomized, crossover trial in patients with type 1 diabetes
Abstract
Background: Iatrogenic peripheral hyperinsulinemia, resulting from peripheral insulin administration in type 1 diabetes, may increase insulin resistance and impair endothelial function. We hypothesized that lowering iatrogenic peripheral hyperinsulinemia via a one-week, reduced-carbohydrate diet (RCD) would improve insulin sensitivity and endothelial function compared with an isocaloric standard carbohydrate diet (SCD).
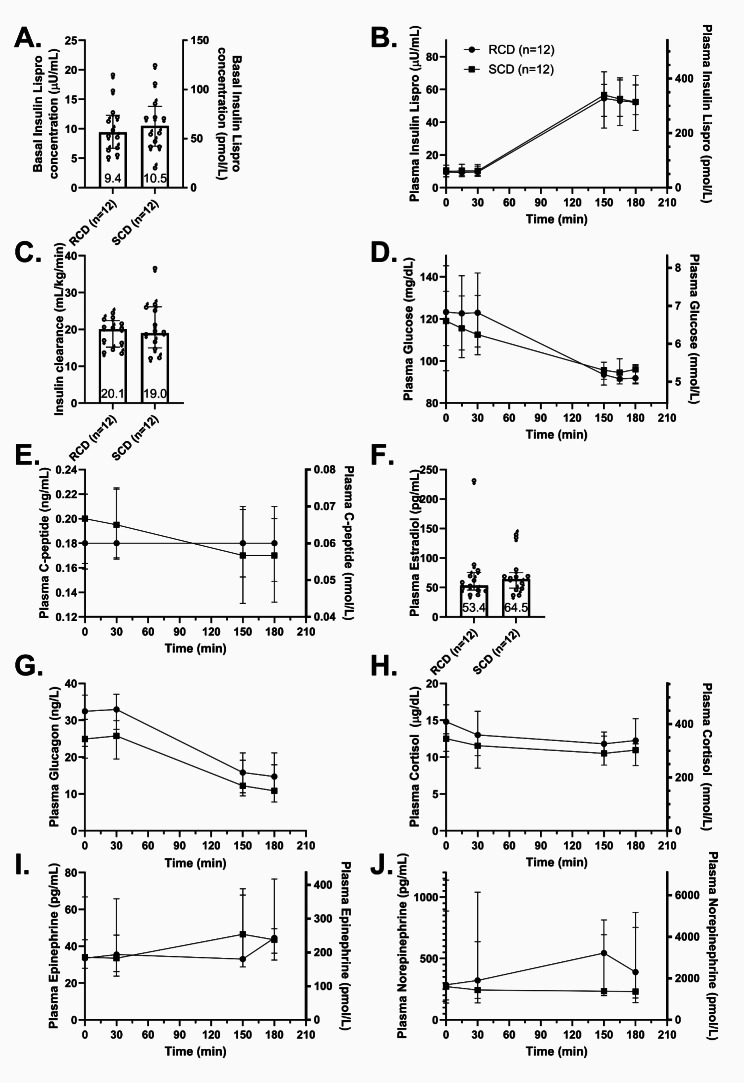
Methods: In this randomized, single-blinded, crossover trial, we studied 12 adults with type 1 diabetes. Participants completed both a one-week RCD and a one-week SCD, separated by a three-week washout. After each intervention, we measured insulin sensitivity using a hyperinsulinemic-euglycemic clamp and assessed endothelial function via brachial-artery flow-mediated vasodilation (FMD).
Results: The RCD reduced total daily insulin doses by 16% compared with the SCD. Despite this reduction, insulin sensitivity did not improve (median glucose infusion rates: RCD 8.1 mg/kg FFM/min [IQR 6.7-10.1] vs. SCD 8.6 mg/kg FFM/min [7.0-11.0], p = 0.47). Similarly, endothelial function did not differ significantly (FMD after RCD 7.50% [3.25-15.5] vs. SCD 9.81% [4.96-14.3], p = 0.91). Although higher insulin doses correlated with lower insulin sensitivity under both conditions, lowering insulin dose through the RCD alone did not yield measurable improvements.
Conclusions: Although a one-week RCD significantly lowered insulin requirements, it failed to enhance insulin sensitivity or endothelial function in adults with type 1 diabetes. These findings underscore the complex and dynamic relationship between insulin exposure and cardiometabolic health. Similar basal overnight insulin delivery may have masked potential benefits by the time of testing, highlighting the need for further studies to refine strategies aimed at mitigating hyperinsulinemia's adverse effects.
Trial registration: ClinicalTrials.gov NCT04118374.
Keywords: Endothelial dysfunction; Endothelial function; Hyperinsulinemia; Insulin resistance; Insulin sensitivity; Reduced-carbohydrate diet; Type 1 diabetes.
© 2025. The Author(s).
Conflict of interest statement
Declarations. Ethics approval and consent to participate: All participants provided written informed consent. The study was approved by the Vanderbilt University Institutional Review Board and registered at ClinicalTrials.gov (NCT04118374). Consent for publication: Not applicable. Competing interests: J.M.G. has received consulting fees from vTV therapeutics, DRI Capital Inc., Beckman Coulter Inc., and Sanofi; reimbursement for serving on scientific advisory committees for vTV therapeutics and Sanofi; honoraria for educational events with MJH Life Sciences; and payments for participation on a clinical events committee for Medtronic. J.A.B. has received consulting fees from Cook, JanOne, Merck, Medtronic, Novartis, and Tourmaline. A.D.C. serves on scientific advisory boards or as a consultant for AdipoPharma, Fractyl Health, Inc., Pioneering Medicine, Portal Insulin, Sekkei Bio, and Sensulin Labs, LLC. Abvance, Novo Nordisk, Paratus, and Thetis Pharmaceuticals, LLC; and is receiving research grant support from Abvance, Alnylam, and Novo Nordisk.
Figures


References
-
- Groop PH, Thomas M, Feodoroff M, Forsblom C, Harjutsalo V. Excess mortality in patients with type 1 diabetes without Albuminuria-Separating the contribution of early and late risks. Diabetes Care. 2018;41(4):748–54. - PubMed
-
- Lind M, Svensson AM, Kosiborod M, Gudbjörnsdottir S, Pivodic A, Wedel H, et al. Glycemic control and excess mortality in type 1 diabetes. N Engl J Med. 2014;371(21):1972–82. - PubMed
-
- The effect of intensive treatment of diabetes on the. Development and progression of long-term complications in insulin-dependent diabetes mellitus. The diabetes control and complications trial research group. N Engl J Med. 1993;329(14):977–86. - PubMed
-
- Jarvisalo MJ, Raitakari M, Toikka JO, Putto-Laurila A, Rontu R, Laine S, et al. Endothelial dysfunction and increased arterial intima-media thickness in children with type 1 diabetes. Circulation. 2004;109(14):1750–5. - PubMed
Publication types
MeSH terms
Substances
Associated data
Grants and funding
LinkOut - more resources
Full Text Sources
Medical
