. 2025 Mar 5;22(1):65.
doi: 10.1186/s12974-025-03381-y.

Bystander neuronal progenitors in forebrain organoids promote protective antiviral responses

Affiliations

Bystander neuronal progenitors in forebrain organoids promote protective antiviral responses

Seble G Negatu et al. J Neuroinflammation. .

Abstract

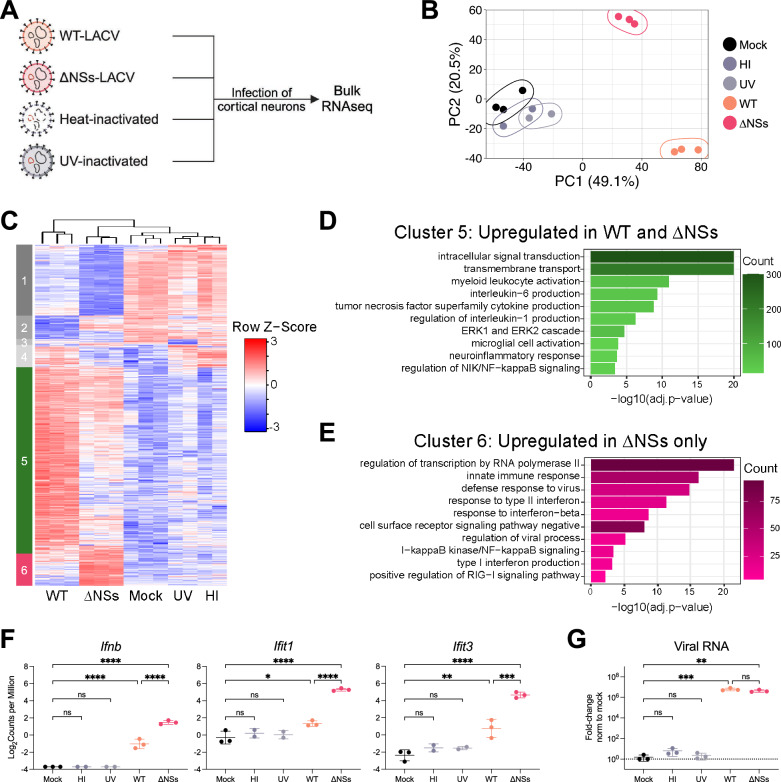
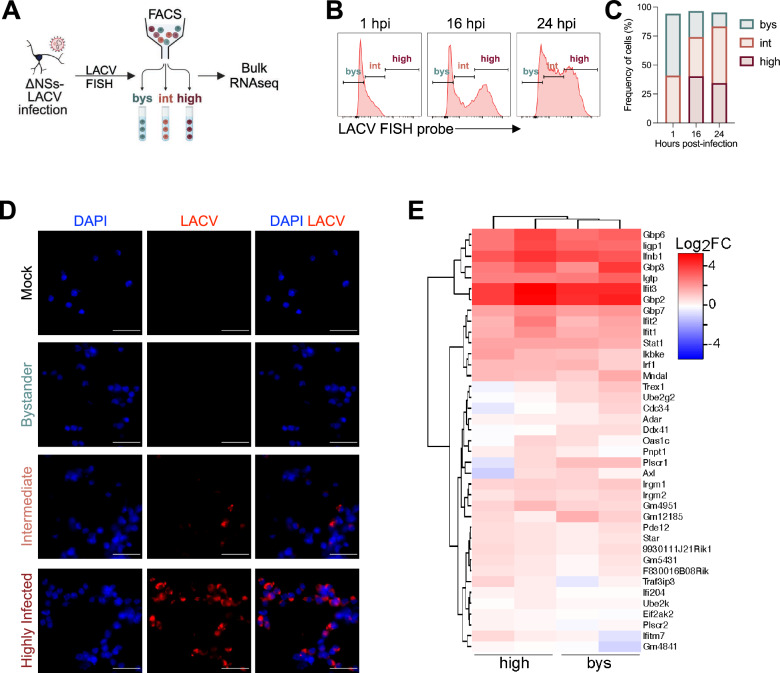
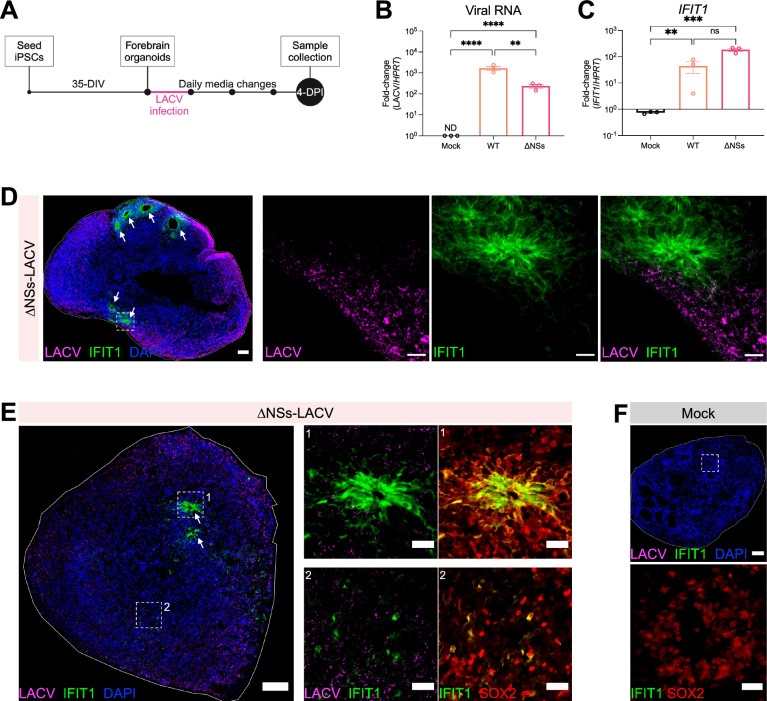
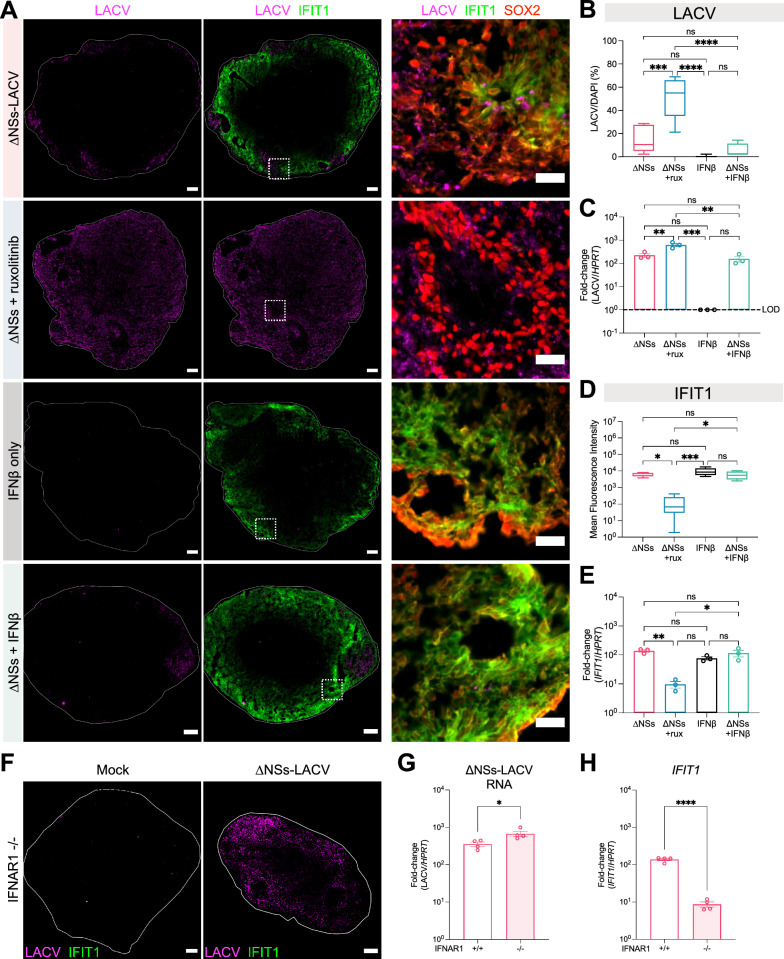
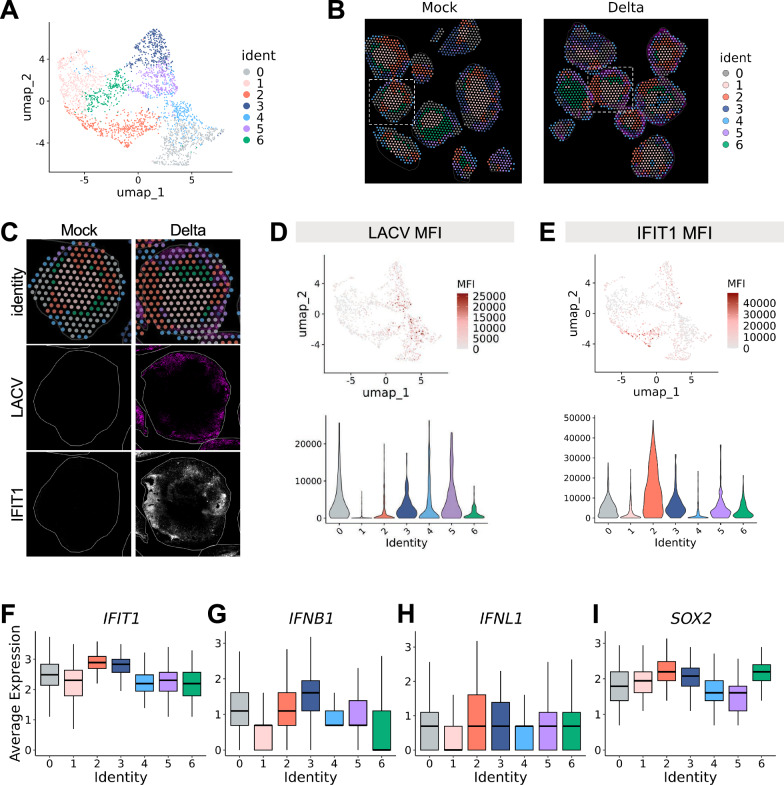
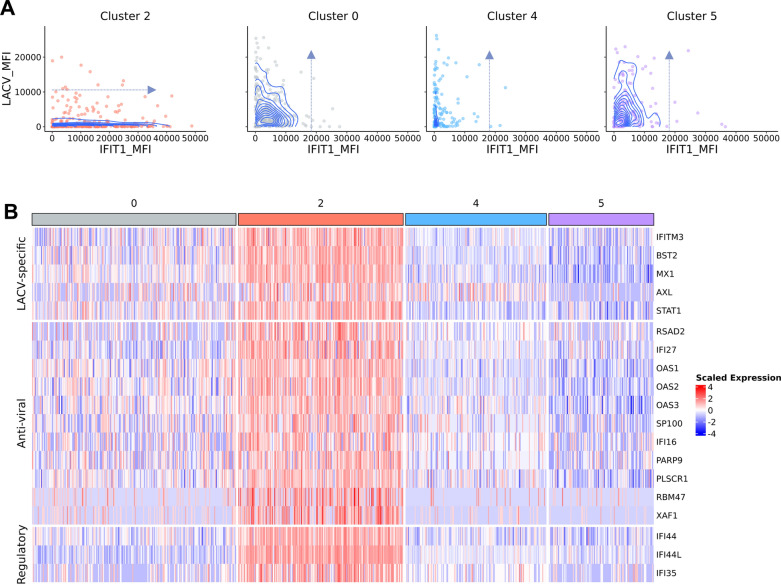
Neurotropic viruses are the most common cause of infectious encephalitis and highly target neurons for infection. Our understanding of the intrinsic capacity of neuronal innate immune responses to mediate protective antiviral responses remains incomplete. Here, we evaluated the role of intercellular crosstalk in mediating intrinsic neuronal immunity and its contribution to limiting viral infection. We found that in the absence of viral antagonism, neurons transcriptionally induce robust interferon signaling and can effectively signal to uninfected bystander neurons. Yet, in two-dimensional cultures, this dynamic response did not restrict viral spread. Interestingly, this differed in the context of viral infection in three-dimensional forebrain organoids with complex neuronal subtypes and cellular organization, where we observed protective capacity. We showed antiviral crosstalk between infected neurons and bystander neural progenitors is mediated by type I interferon signaling. Using spatial transcriptomics, we then uncovered regions containing bystander neural progenitors that expressed distinct antiviral genes, revealing critical underpinnings of protective antiviral responses among neuronal subtypes. These findings underscore the importance of interneuronal communication in protective antiviral immunity in the brain and implicate key contributions to protective antiviral signaling.


Conflict of interest statement

Declarations. Ethics approval and consent to participate: Not applicable. Consent for publication: Not applicable. Competing interests: The authors declare no competing interests.

Figures

Fig. 1
Fig. 1
Viral antagonism masks neuronal intrinsic capacity to induce robust interferon signaling. Primary cortical neurons were isolated from murine embryo cortices at embryonic day 16.5. Isolated neurons were either mock-treated (Mock) or infected at 0.5 MOI for 16 h with wild-type-La Crosse Virus (WT-LACV); recombinant ∆NSs-La Crosse Virus (∆NSs-LACV); heat-inactivated ∆NSs-LACV (HI); or ultraviolet-inactivated ∆NSs-LACV (UV) followed by bulk RNA sequencing of total RNA. A Schematic of experimental design. B Principal component analysis showing PC1 and PC2 for bulk RNA sequencing data from mock-treated and infected neurons. C Heat map of gene expression data scaled by z-score for each row. Columns represent samples clustered using Spearman correlation, and rows represent differentially expressed genes compared to mock clustered using Pearson correlation. Genes in the heatmap met cutoffs of p-value = 0.01 and log fold-change = ±1. Functional enrichment analysis of genes from cluster 5 (D) and cluster 6 (E) using Gene Ontology biological processes. F Log2 adjusted counts per million of select innate antiviral genes in cluster 6. Data are presented as means ± SD. Statistical analysis performed with one-way ANOVA followed by Tukey’s test. G Fold change of LACV RNA was determined by quantitative RT-PCR relative to the housekeeping gene Hprt, normalized to mock. Neurons were pooled from 2 litters. Data are presented as means ± SD. Statistical analysis performed with one-way ANOVA followed by Tukey’s test, ns p > 0.05, *p < 0.05, **p < 0.01, ***p < 0.001, and ****p < 0.0001
Fig. 2
Fig. 2
Uninfected bystander neurons induce innate immune responses. Primary cortical neurons were isolated from murine embryo cortices at embryonic day 16.5. Isolated neurons were either mock-treated (Mock) or infected at 0.5 MOI for 16 h with recombinant ∆NSs-La Crosse Virus (∆NSs-LACV). A Schematic of adapted probe-seq pipeline where mock-treated or ∆NSs-LACV-infected murine cortical neurons were stained with LACV FISH probes prior to FACS sorting of three populations, bystander (bys); intermediate (int); and highly infected (high) neurons, for bulk RNA sequencing. Flow cytometry analysis of ∆NSs-LACV-infected neurons stained with LACV FISH probes and collected at 1-, 16- and 24-h post-infection (HPI). Gating (B) and quantification (C) of neurons. Neurons were pooled from 1 litter. D Representative fluorescence images of FACS-sorted ΔNSs-LACV-infected neurons at 16-HPI. LACV RNA was labeled by FISH probes (red) and neurons were stained for DAPI (nuclei, blue). Scale bars—25 μm. E Heatmap represents the log2 fold-change of genes from a response to interferon alpha/beta gene list in highly-infected (high) and bystander (bys) neurons relative to mock-treated cells. The gene list was curated from MSigDB GoBP’s “Response to interferon alpha” and “Response to interferon beta.” Neurons were pooled from 1 litter per independent experiment (N = two independent experiments)
Fig. 3
Fig. 3
Interneuronal communication within human forebrain organoids reveal protective ISG production by bystander neural progenitors. 35-days in-vitro (DIV) human induced pluripotent stem cell-derived forebrain organoids were infected with 2.5 × 106 PFU WT-LACV; ∆NSs-LACV; or mock treated for 24-h. Organoid media was replenished with fresh media daily until sample collection at 4-days post-infection (DPI). A Schematic of experimental design. Fold change of LACV RNA (B) and IFIT1 (C) was determined by quantitative RT-PCR relative to the housekeeping gene HPRT. Data are presented as means ± SEM (N = three biological replicates). Statistical analysis performed with one-way ANOVA followed by Tukey’s test, ns p > 0.05, **p < 0.01, ***p < 0.001, ****p < 0.0001. D Representative immunofluorescent images of 35-DIV forebrain organoids at 4-DPI with ΔNSs-LACV. White-dashed box indicates an inset. White arrows indicate IFIT1+ rosettes. Organoid sections were stained for LACV glycoprotein (magenta); IFIT1 (green); and DAPI (cell nuclei, blue). Scale bar of whole organoid—100 μm and inset—25 μm. Representative of 3 independent samples. Immunofluorescent images of ΔNSs-LACV-infected (E) or mock-treated (F) organoids. White-dashed boxes indicate insets labeled with corresponding numbers. White arrows indicate IFIT1+ rosettes. LACV glycoprotein (magenta); IFIT1 (green); Sox2 progenitor (red); cell nuclei, DAPI (blue). Scale bars of whole organoids—100 μm and inset—25 μm (N = three independent experiments)
Fig. 4
Fig. 4
Interferon signaling within bystander neural progenitors limits viral spread and replication. AE 35-DIV forebrain organoids were infected with 2.5 × 106 PFU ∆NSs-LACV alone; 2.5 × 106 PFU ∆NSs-LACV and ruxolitinib (janus-kinase inhibitor); treated with recombinant IFNβ alone; or 2.5 × 106 PFU ∆NSs-LACV and recombinant IFNβ. Infection for 24-h followed by daily media changes and sustained ruxolitinib or recombinant IFNβ treatment until sample collection at 4-DPI for immunofluorescent staining or quantitative RT-PCR. A Representative immunofluorescent images. White-dashed boxes indicate insets. Sectioned organoids were stained with LACV glycoprotein (magenta); IFIT1 (green); and SOX2 progenitor (red). Scale bars of whole organoids—100 μm and insets—25 μm. B Quantification of LACV + area relative to DAPI + area in immunofluorescent images (A). C Fold change of LACV RNA at 4-DPI was determined by quantitative RT-PCR relative to housekeeping gene, HPRT. D Quantification of IFIT1 mean fluorescent intensity in immunofluorescent images (A). E Fold change of IFIT1 at 4-DPI as determined by quantitative RT-PCR relative to housekeeping gene, HPRT. 2–3 sections per experiment were used for quantification of immunofluorescent images. Data presented as means ± SEM (N = three independent experiments). Statistical analyses performed with one-way ANOVA followed by Tukey’s test. F Representative immunofluorescent images of IFNAR1 knockout (IFNAR1 −/−) organoids that were mock-treated or infected with 2.5 × 106 PFU ∆NSs-LACV for 24-h followed by daily media changes until 4-DPI. Sectioned organoids were stained with LACV glycoprotein (magenta) and IFIT1 (green). Scale bars of whole organoids—100 μm. G, H Wild type (+/+) or knock out (−/−) IFNAR1 forebrain organoids were infected with ∆NSs-LACV for 24-h followed by daily media changes until 4-DPI. Fold change of LACV RNA (G) and IFIT1 (H) was determined by quantitative RT-PCR relative to housekeeping gene, HPRT. Data presented as means ± SEM (N = five independent experiments). Statistical analysis performed with unpaired Student’s t test, ns p > 0.05, *p < 0.05, **p < 0.01, ***p < 0.001, ****p < 0.0001
Fig. 5
Fig. 5
Spatial transcriptomics uncovers distinct regions of progenitor bystander activation. 35-DIV forebrain organoids were mock-treated or infected with 2.5 × 106 PFU ∆NSs-LACV and collected at 4-DPI for spatial transcriptomics using the Visium platform. A Uniform manifold approximation and projection (UMAP) of spatial transcriptomics spots that are representative of 1407 spots in 8 ΔNSs-LACV-infected organoids and 1470 spots in 9 mock-treated forebrain organoids. B Spatial clusters were aligned to immunofluorescent images of mock-treated or ∆NSs-LACV-infected samples. Serial sections were stained with LACV glycoprotein (magenta). C Representative organoids (dashed-white boxes in B) with spatial clusters (identity) and aligned immunofluorescent images below; Serial sections were stained with LACV glycoprotein (magenta) and IFIT1 (white). Quantification of LACV glycoprotein (D) or IFIT1 (E) mean fluorescence intensity (MFI) within each spot of ΔNSs-LACV-infected organoids using ImageJ. Upper, data represented in UMAP feature plot and lower, data represented as violin plot. Box plots showing IFIT1 (F); IFNB1 (G); IFNL1 (H); and SOX2 (I) expression in ΔNSs-LACV-infected organoids
Fig. 6
Fig. 6
Spatial resolution reveals critical underpinnings of protective antiviral response in neurons. 35-DIV forebrain organoids were mock-treated or infected with 2.5 × 106 PFU ∆NSs-LACV and collected at 4-DPI for spatial transcriptomics using the Visium platform (Fig. 5). Using Seurat, a subset of clusters 0, 2, 4, and 5 in ∆NSs-LACV-infected organoids were used for further analysis. A LACV glycoprotein or IFIT1 mean fluorescence intensity (MFI) within each spot of ΔNSs-LACV-infected organoids were quantified using ImageJ. Density plots represent correlation of LACV and IFIT1 MFI in clusters 0, 2, 4, and 5 of ΔNSs-LACV-infected organoids. Blue-dashed arrow indicates correlation trends. B Differential expression (DE) analysis comparing cluster 2 to clusters 0, 4, and 5 was conducted. 229 DE genes with a log2 fold-change >1 were identified. Interferon-stimulated genes and/or antiviral genes against LACV identified within the gene list were displayed in the heatmap display as scaled expression

Similar articles

Cited by

References

    1. Ludlow M, et al. Neurotropic virus infections as the cause of immediate and delayed neuropathology. Acta Neuropathol (Berl). 2016;131:159–84. - PMC - PubMed
    1. Klein RS, et al. Neuroinflammation during RNA viral infections. Annu Rev Immunol. 2019;37:73–95. - PMC - PubMed
    1. Peltier DC, Simms A, Farmer JR, Miller DJ. Human neuronal cells possess functional cytoplasmic and TLR-mediated innate immune pathways influenced by phosphatidylinositol-3 kinase signaling. J Immunol. 2010;184:7010–21. - PMC - PubMed
    1. Chakraborty S, Nazmi A, Dutta K, Basu A. Neurons under viral attack: victims or warriors? Neurochem Int. 2010;56:727–35. - PMC - PubMed
    1. Delhaye S, et al. Neurons produce type I interferon during viral encephalitis. Proc Natl Acad Sci U S A. 2006;103:7835–40. - PMC - PubMed

LinkOut - more resources