. 2025 Mar 5;16(1):117.
doi: 10.1186/s13287-025-04155-2.

Effects of intra-articular applied rat BMSCs expressing alpha-calcitonin gene-related peptide or substance P on osteoarthritis pathogenesis in a murine surgical osteoarthritis model

Affiliations

Effects of intra-articular applied rat BMSCs expressing alpha-calcitonin gene-related peptide or substance P on osteoarthritis pathogenesis in a murine surgical osteoarthritis model

Sabine Stöckl et al. Stem Cell Res Ther. .

Abstract

Background: About 655 million persons worldwide are affected by osteoarthritis (OA). As no therapy modifies disease progression long-term, there is an immense clinical need for novel therapies. The joints are innervated by alpha calcitonin gene-related peptide (αCGRP)- and substance P (SP)-positive sensory nerve fibers. Both neuropeptides have trophic effects on target cells within the joints. The aim of this study was to examine the effects of SP- and αCGRP-expressing intra-articular (i.a.) applied rat(r)BMSC on cartilage and subchondral bone structural changes after OA induction.

Methods: Mice were subjected to destabilization of the medial meniscus (DMM) surgery, followed by i.a. injections with rBMSC, transduced with lacZ, SP or αCGRP. 2, 8 and 16 weeks after DMM/Sham surgery, motion analysis and serum marker analysis were performed. Cartilage and subchondral bone properties were assessed by OA scoring, atomic force microscopy and nano-CT analysis.

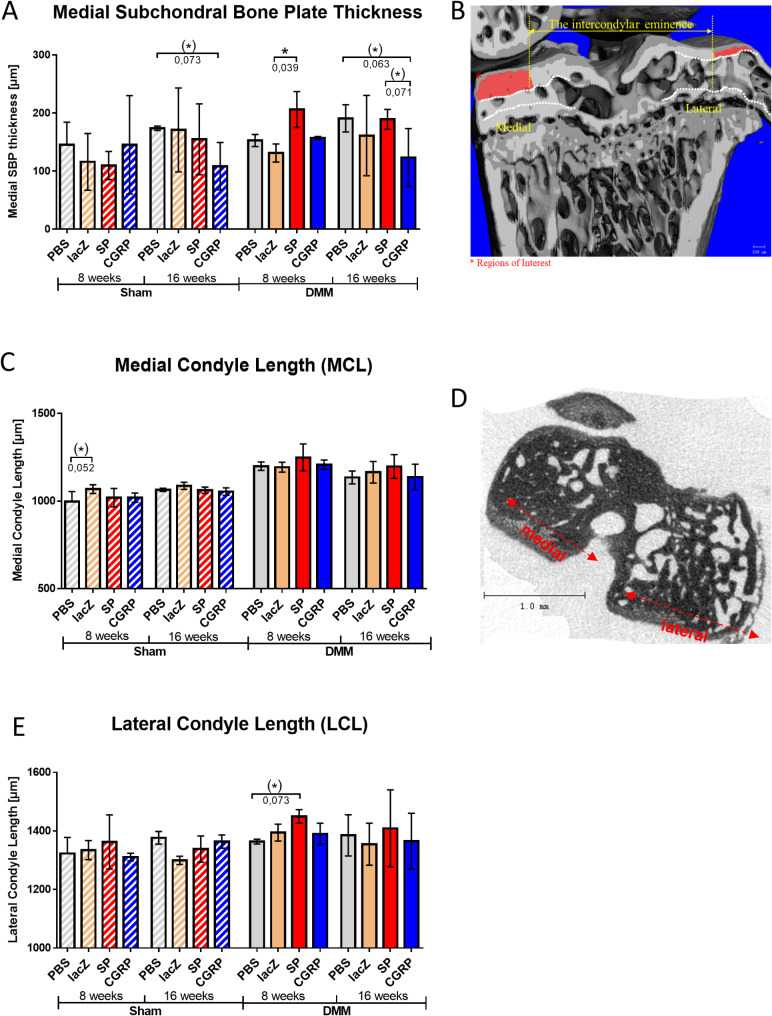
Results: OARSI scores of the medial cartilage compartments indicated induction and progression of OA after DMM surgery in all groups. Differences between the treatment groups were mostly restricted to the lateral cartilage compartments, where αCGRP caused a decrease of structural changes. DMM-rBMSC-αCGRP or -SP mice displayed decreased cartilage stiffness in the cartilage middle zone. DMM-rBMSC-αCGRP mice revealed improved mobility, whereas Sham-rBMSC-SP mice revealed reduced mobility compared to rBMSC-lacZ. With respect to condyle length, subarticular bone and ephiphyseal bone morphology, DMM-rBMSC-SP mice had more alterations indicating either a more progressed OA stage or a more severe OA pathology compared to controls. In addition, DMM-rBMSC-SP mice developed osteophytes already 8 weeks after surgery. Adiponectin serum level was increased in DMM-rBMSC-αCGRP mice, and MIP1b level in DMM-rBMSC-SP mice. Notably, pain and inflammation markers increased over time in rBMSC-SP mice while rBMSC-αCGRP mice revealed a bell-shaped curve with a peak at 8 weeks.

Conclusions: We conclude that i.a. injection of rBMSC in general have a beneficial effect on cartilage matrix structure, subchondral bone microarchitecture and inflammation. rBMSC-αCGRP have anabolic and possible analgesic properties and may attenuate the progression or severity of OA. In contrast, rBMSC-SP exert a more catabolic influence on knee joints of both, Sham and DMM mice, making it a potential candidate for inhibition studies.

Keywords: AFM; BMSC; DMM; Motion analysis; Nanoct; Osteoarthritis; SP; Serum marker; αCGRP.


Conflict of interest statement

Declarations. Ethical approval: Title of the project: Der Einfluss des sensiblen Nervensystems (SP- und alphaCGRP-positive Nervenfasern) auf die OA Pathogenese. The local authorities in Würzburg (Regierung von Unterfranken) approved all animal experiments. Approval number: AZ 55.2-2532-2-306. Date of approval: 15th of September 2016. Consent for publication: Not applicable. Usage of AI: The authors declare that they have not used Artificial Intelligence in this study. Competing interests: The authors declare that they have no competing interests.

Figures

Fig. 1
Fig. 1
Scheme of animal experimental time lines. 12 weeks old male C57Bl/6J (WT) mice were subjected either to DMM or sham surgery and randomly divided into four groups (SP, αCGRP, lacZ or PBS) each according to type of injection post-surgery. At indicated time points, these groups were subjected to intra-articular (i.a.) injection of 350.000 of either rBMSC-SP, rBMSC-αCGRP, rBMSC-lacZ (in 7 µl PBS) or 7 µl PBS (no cells). At longer follow up times, i.a. injections were either repeated 1 × (8 weeks: total of 2 injections) or 3 × (16 weeks: total of 4 injections). Follow up was finished either after two weeks (early OA stage), eight weeks (full OA stage) and 16 weeks (late OA stage). A day before euthanasia, mice were subjected to motion analysis and directly before euthanasia blood removal for serum marker analysis. After euthanasia, knees were removed for OA scoring, Atomic Force Microscopy (AFM) analysis and nano-CT analysis
Fig. 2
Fig. 2
Transduction of rBMSC and gene and protein expression of SP and αCGRP. A) Murine cDNA for SP, αCGRP and lacZ was cloned into lentiviral expression vectors, and viral particle were generated using a 293FT producer cell line. Subsequently, naive rBMSC were transduced with these viruses to produce lacZ-, αCGRP- or SP (over-) expressing rBMSCs clones. B) Gene expression analysis for SP and αCGRP was performed to verify expression level in transduced rBMSC in comparison to lacZ control rBMSC. C, D) SP and αCGRP protein concentration was determined in the cell culture supernatant of transduced rBMSC and adjusted to the secreted level from rBMSC-lacZ. E, F) SP and αCGRP protein concentration was determined in 3.5 × 105 transduced rBMSC, which corresponds to the number of cells per i.a. injection. Protein concentration of the neuropeptides was compared to that of the rBMSC-lacZ group. Results are means +/- SD; one sample t-test **p ≤ 0,01; N = 7–9
Fig. 3
Fig. 3
OARSI scores of rBMSC treated mice 2, 8 and 16 weeks post DMM or sham surgery. Comparison of the means of the OARSI scores of the articular cartilages from the (A-C) medial femoral condyle, (D-F) medial tibia plateau, (G-I) lateral femoral condyle and (J-L) lateral tibia plateau from all four treatment groups, 2, 8 and 16 weeks after either DMM or sham surgery. Sham/DMM lacZ = rBMSC-lacZ group; Sham/DMM SP = rBMSC-SP group; Sham/DMM αCGRP = rBMSC-αCGRP group; 2-way ANOVA; *p ≤ 0,05; **p ≤ 0,01; N = 4–6
Fig. 4
Fig. 4
IT-AFM-based analysis of articular cartilage matrix stiffness of the middle cartilage zone (MZ) at 8 weeks post DMM or sham surgery. A) Histograms of Young’s modulus (stiffness) distributions of the MZ cartilage matrix of mice 8 weeks after DMM or sham surgery and injection of either PBS, lacZ-, αCGRP- or SP-expressing rBMSC. The continuous red or blue lines in each histogram represent a fit to the data using a linear combination of two Gaussian distributions; the dashed red or blue lines show the individual Gaussian distributions representing the proteoglycan (left) and the collagen (right) Young’s moduli, respectively. Dashed black lines between all histograms within one surgery type (sham or DMM) indicate peak shifts due to each rBMSC-injection compared to the control PBS injection. N = 3. B) Mean Young’s modulus (stiffness) of the proteoglycan peak and the collagen peak of the MZ cartilage at 8 weeks after DMM or sham surgery and i.a. injection of either PBS, lacZ-, αCGRP- or SP-(over)expressing rBMSC. Bars show mean ± standard error of the mean. 2-Sided t-test of independent samples between types of surgery (per injection within the MZ) and injection vs. injection (per type of surgery within the MZ). N = 3. C) Overview phase contrast optical microscopy image of a frontal cryosection of native (non-decalcified) mouse articular cartilage indicating the different cartilage zones (SZ, MZ, DZ) included into the analysis. D) Scheme shows the principle of IT-AFM on articular cartilage in two steps: (1) The cantilever (a) holding the tip on its underside approaches the cartilage sample (b). (2) As soon as contact between tip and sample is established the cantilever bends while the tip indents the sample. The deformation of the cantilever is detected via a laser pointed at its upper side and recorded together with the vertical displacement for further analysis
Fig. 5
Fig. 5
Motion analysis of rBMSC-treated mice 8 and 16 weeks post DMM or sham surgery. 8 and 16 weeks after DMM or sham surgery, mice were subjected to video-tracking motion analysis to determine mobility activity. The mice were analyzed for the moved distance (in cm) (A, C) and the velocity (cm/s) (B, D) using Ethovision XT software. Sham/DMM lacZ = rBMSC-lacZ group; Sham/DMM SP = rBMSC-SP group; Sham/DMM αCGRP = rBMSC-αCGRP group; Mann-Whitney-test; N = 11–13; *p ≤ 0.05; **p ≤ 0.01
Fig. 6
Fig. 6
Nano CT analysis of medial subchondral bone plate thickness (SCBP) and the medial and lateral condyle length. (A) Quantification of the SCBP thickness in the control (PBS and rBMSC-lacZ) and the rBMSC-αCGRP- and–SP groups, 8 or 16 weeks after the DMM or sham surgery. Image on the right shows the representative image of the tibial plateau with the corresponding ROI marked by * and red bars. (B) Diagram of the medial condyle length and C) of the lateral condyle length in the different treatment groups, 8 or 16 weeks after the DMM or sham surgery. Representative µCT images display the tibial plateau, as well as an representatively measured condyle length. Generalized Linear Model (GLM); n (total) = 48; N (per group) = 3; *p ≤ 0.05; **p ≤ 0.01
Fig. 7
Fig. 7
NanoCT analysis of the medial epiphyseal morphology. Diagram of the (A) bone volume fraction (BV/TV), (B) bone mineral density (BMD), (C) trabecular number (Tb.N.), and (D) trabecular thickness (Tb.Th.) in the epiphyseal bone region. A schematic illustration of the corresponding volume of interest (VOI) is depicted in (E). Generalized Linear Model (GLM); N (total) = 48; N (per group) = 3; *p ≤ 0.05; **p ≤ 0.01
Fig. 8
Fig. 8
NanoCT analysis of the subarticular morphology. Diagram of the (A) bone volume fraction (BV/TV), (B) bone mineral density (BMD), (C) trabecular number (Tb.N.), and (D) trabecular thickness (Tb.Th.) in this region. A schematic illustration of the corresponding volume of interest (VOI) is depicted in (E). Generalized Linear Model (GLM); n (total) = 48; N (per group) = 3; *p ≤ 0.05; **p ≤ 0.01
Fig. 9
Fig. 9
Serum concentrations of adiponectin, MIP1b and MCP-1 at 16 weeks after DMM/Sham surgery. Concentration of adiponectin (A), and concentration of MIP1b (B) and MCP-1 (C) in the serum of the four treatment groups 16 weeks after DMM or Sham surgery. Mann-Whitney p* ≤ 0,05; N = 3–4

References

    1. Hunter DJ, Bierma-Zeinstra S. Osteoarthr Lancet. 2019;393(10182):1745–59. - PubMed
    1. Loeser RF, Goldring SR, Scanzello CR, Goldring MB. Osteoarthritis: a disease of the joint as an organ. Arthritis Rheum. 2012;64(6):1697–707. - PMC - PubMed
    1. Cross M, Smith E, Hoy D, Nolte S, Ackerman I, Fransen M, Bridgett L, Williams S, Guillemin F, Hill CL, et al. The global burden of hip and knee osteoarthritis: estimates from the global burden of disease 2010 study. Ann Rheum Dis. 2014;73(7):1323–30. - PubMed
    1. Diduch DR, Crawford DC, Ranawat AS, Victor J, Flanigan DC. Implantable shock Absorber provides Superior Pain Relief and functional improvement compared with high tibial osteotomy in patients with mild-to-moderate medial knee osteoarthritis: a 2-Year report. Cartilage. 2023;14(2):152–63. - PMC - PubMed
    1. Grassel SG. The role of peripheral nerve fibers and their neurotransmitters in cartilage and bone physiology and pathophysiology. Arthritis Res Therapy. 2014;16(6):485. - PMC - PubMed

Substances