. 2025 Mar 5;20(1):28.
doi: 10.1186/s13024-025-00807-2.

Srebf2 mediates successful optic nerve axon regeneration via the mevalonate synthesis pathway

Affiliations

Srebf2 mediates successful optic nerve axon regeneration via the mevalonate synthesis pathway

Mengming Hu et al. Mol Neurodegener. .

Abstract

Background: Axon regeneration within the mammalian central nervous system is extremely limited. In optic neuropathy conditions like glaucoma, the inability of retinal ganglion cell (RGC) axons to regenerate is a major impediment to functional recovery. In contrast, adult teleost fish such as zebrafish can fully regenerate RGC axons enabling visual recovery from optic nerve (ON) injury making it an ideal model to probe the mechanisms of successful axon regeneration.

Methods: Laser Capture Microdissection followed by RNA-sequencing (LCM-seq) was used to identify genes and pathways differentially expressed in RGCs during ON regeneration. We validate these findings by in situ hybridization and qRT-PCR. Using loss- and gain-of-function experiments we demonstrate the necessity of srebf2 for efficient ON regeneration and recovery of visual function. Finally, we use LCM-seq coupled with experimental manipulations to identify downstream srebf2 target genes and test the role of hmgcra/b and mevalonate in this process. Statistical analysis was performed using Student's t-test, two-way ANOVA, or repeated measures with appropriate post-hoc tests where applicable.

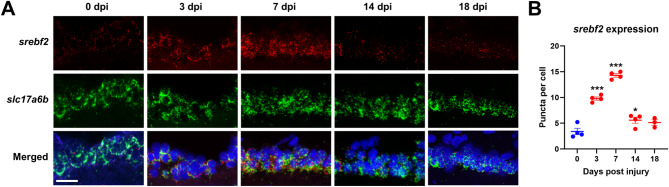
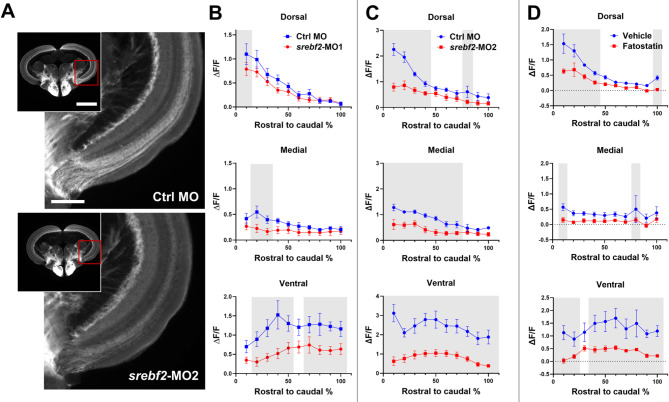
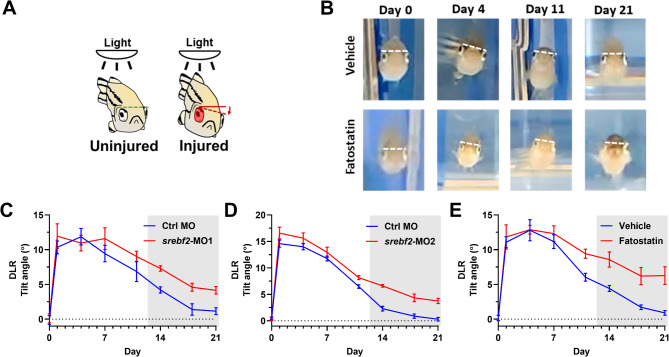
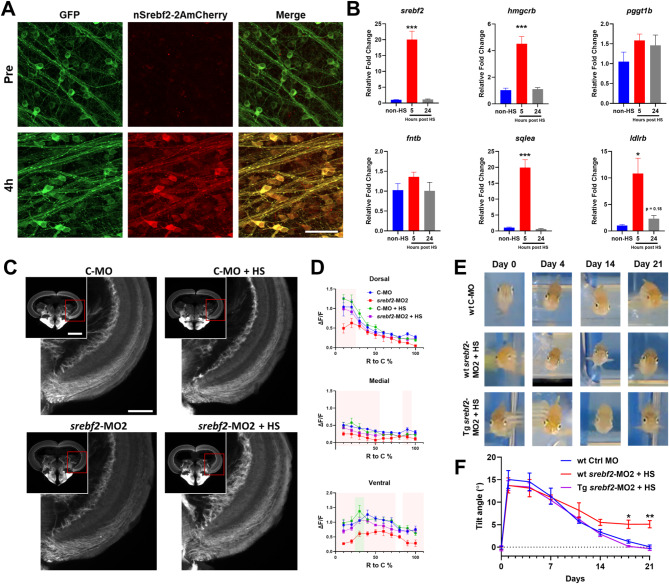
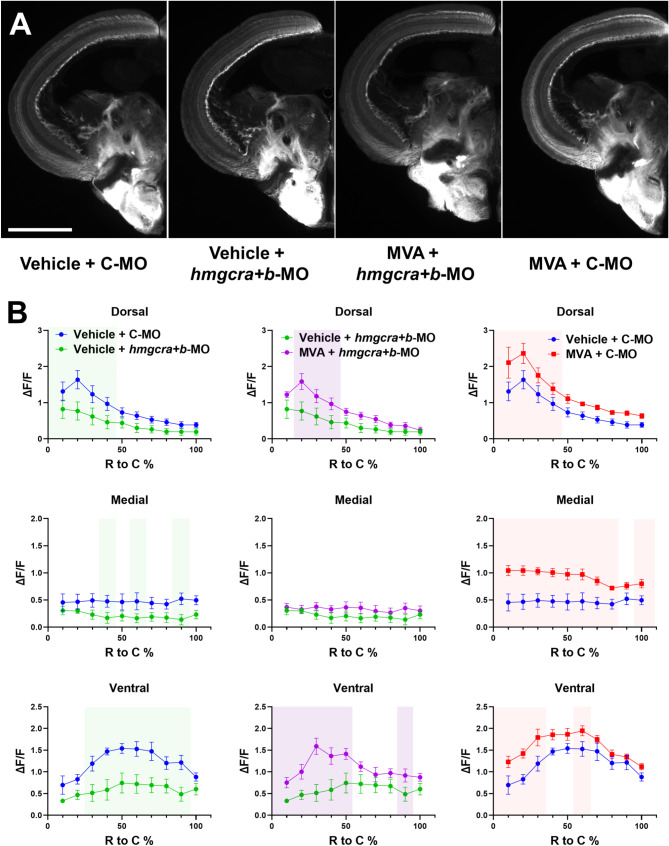
Results: LCM-seq comparison of uninjured versus 3-day post ON injury RGCs identified significant upregulation of the cholesterol synthesis pathway during axon regeneration. The master regulator of this pathway, the transcription factor srebf2, is upregulated throughout the regeneration phase. Chemical inhibition or morpholino-based gene knockdown of srebf2 decreased axon regeneration into the ON and optic tectum and delayed recovery of visual behavior over the course of normal optic nerve regeneration without causing a significant loss of RGCs. Constitutively active srebf2 can fully rescue axon regeneration and visual behavior losses caused by inhibition of endogenous srebf2 but does not accelerate regeneration compared to the control group. LCM-seq confirms the expected regulation of predicted srebf2 target genes after loss- or gain-of-function in vivo. Downstream of srebf2, hmgcra/b knockdown or simvastatin treatment delayed axon regeneration and this effect was rescued by supplemental mevalonate. Mevalonate treatment alone was sufficient to accelerate ON regeneration.

Conclusions: These results demonstrate that srebf2 and the downstream mevalonate synthesis pathway plays an important role in regulating efficient axon regeneration in the zebrafish visual system. Involvement of this pathway should be closely examined in failed mammalian ON regeneration.

Keywords: Axon; Cholesterol; Mevalonate; Optic nerve; Regeneration; Retinal ganglion cell; Zebrafish; srebf2.


Conflict of interest statement

Declarations. Competing interests: The authors declare no competing interests.

Figures

Fig. 1
Fig. 1
LCM-seq analysis of 3 dpi retinal ganglion cell layer (GCL) identifies upregulation of the cholesterol synthesis pathway. (A) Representative image from pre- and post-GCL LCM retina section. (B) Volcano plot (|FoldChange| > 1, FDR < 0.05) of differentially expressed gene from 3 dpi (n = 3) vs. uninjured GCL (n = 2). (C) GSEA of DEGs genes based on zebrafish WikiPathways. (D) Heatmap of cholesterol-related transcriptional regulators, cholesterol synthases, and cholesterol trafficking genes of 3 dpi vs. uninjured from GCL. Gene names in red or blue indicates p < 0.05 by DEseq2 in 3 dpi group versus control where red represents upregulated genes and blue represents downregulated genes
Fig. 2
Fig. 2
srebf2 is upregulated in RGCs during axon regeneration. (A) Representative images of GCL srebf2 expression at various time points post nerve injury with slc17a6b as RGC marker. (B) Quantification of GCL srebf2 expression. * p < 0.05, and *** p < 0.001 compared with 0 dpi (uninjured). Scale bar = 20 μm. One-way ANOVA with Bonferroni post hoc was used as statistical analysis, n = 4 for each group
Fig. 3
Fig. 3
Srebf2 loss-of-function inhibits axon regeneration in the optic tectum at 7 dpi. (A) Representative images of tectum and higher magnification of medial-ventral tectum of vehicle or fatostatin treated zebrafish. (B) Quantification of tectum regeneration at dorsal, medial, and ventral region after srebf2-MO1 treatment. (C) Quantification of tectum regeneration at dorsal, medial, and ventral region after srebf2-MO2 treatment. (D) Quantification of tectum regeneration at dorsal, medial, and ventral region post fatostatin treatment. Grey boxes indicate p < 0.05 compared with Ctrl MO or Vehicle at the corresponding rostral to caudal distance by two-way ANOVA with Fisher’s LSD post hoc test. Scale bar = 500 and 200 μm, n = 5–6 for each group
Fig. 4
Fig. 4
Srebf2 loss-of-function delays dorsal light response (DLR) recovery. (A) Schematic of the DLR. (B) Representative images of the DLR after nerve injury with vehicle or fatostatin treatment over time. (C) Quantification of DLR recovery after control MO (Ctrl MO) or srebf2-MO1 treatment. (D) Quantification of DLR recovery after control MO (Ctrl MO) or srebf2-MO2 treatment. (E) Quantification of DLR recovery after Vehicle or fatostatin treatment. Grey boxes indicate p < 0.05 compared with Vehicle or Ctrl MO at corresponding days post-injury by two-way ANOVA with Bonferroni post hoc test. The dotted line is a 0-degree tilt angle observed at day 0, n = 5–6 for each group
Fig. 5
Fig. 5
Conditional expression of constitutively active srebf2 rescues loss-of-function but does not accelerate regeneration. (A) mCherry expression in whole mount Tg(hsp70l: nSrebf2-2AmCherry, cmlc: GFP) zebrafish retina GCL before heat shock (Pre) and 4-hours post heat shock (4 h). (B) Expression of selected mev/chol synthesis pathway genes in post heat shock retina measured by qRT-PCR by one-way ANOVA with Bonferroni post hoc test, n = 4 for each group. (C) Representative images of axon regeneration into the optic tectum after treatment with control MO (C-MO) or srebf2-MO2 with and without heat shock rescue (+ HS) by Tg(hsp70l: nSrebf2-2AmCherry, cmlc: GFP). (D) Quantification of regeneration into the optic tectum. Red boxes represent p < 0.05 in C-MO vs. srebf2-MO2 group at the corresponding rostral to the caudal region; green boxes represent p < 0.05 in C-MO vs. C-MO + HS by two-way ANOVA with Fisher’s LSD post hoc test, no other comparisons were statistically significant, n = 5–6 for each group. (E) Representative images of the DLR on various days post nerve injury with C-MO, srebf2-MO2, and srebf2-MO2 plus transgenic heat shock rescue. (F) Quantification of the DLR in each treatment group over time by two-way ANOVA with Bonferroni post hoc test, n = 5–6 for each group. + HS indicates daily heat shock treatment starting at day 0. Scale bar in A = 50 μm. Scale bar in C = 500 μm and 200 μm. * p < 0.05, ** p < 0.01, *** p < 0.001
Fig. 6
Fig. 6
The Cholesterol Biosynthesis pathway is coordinately regulated in the retinal GCL by srebf2 knockdown or constitutively active overexpression at 3 dpi as measured by LCM-seq. A) The six experimental groups being compared by LCM-seq and the heat shock treatment regimen. N = 4 fish per treatment group, two males and two females. B) The mev/chol pathway is up regulated 3 dpi, down regulated by srebf2-MO2 treatment, and up regulated by transgenic (Tg) constitutively active srebf2 over expression in control MO and srebf2-MO2 treated groups (FDR < 0.25). GSEA based on zebrafish Wikipathway. C) Venn diagram for differentially expressed genes (|FoldChange| ≥ 1.5) in the different comparison groups identifies 464 common genes. D) WikiPathways over-representation analysis of the 464 common genes in C enriches for the mev/chol pathway. E) Heatmap of mev/chol synthesis gene expression in each experimental group. 3dpi, uninjured, C-MO, and srebf2-MO2 groups used wt zebrafish; Tg C-MO + HS and Tg srebf2-MO2 + HS used Tg(hsp70l: nSrebf2-2AmCherry, cmlc: GFP) zebrafish with daily heat shock (HS)
Fig. 7
Fig. 7
GCL mev/chol synthesis genes are dependent on srebf2 activity for expression at 3 dpi. (A) Location of the tested genes in the mev/chol pathway. (B) In situ hybridization detection of each gene in uninjured, optic nerve injury, and srebf2-MO2 treated 3 dpi retinal GCL. (C) Quantification of GCL mRNA transcript abundance by one-way ANOVA with Bonferroni post hoc test, n = 4 for each group. Scale bar = 20 μm. * p < 0.05, ** p < 0.01, and *** p < 0.001
Fig. 8
Fig. 8
Axon regeneration into the optic tectum is dependent upon the mevalonate synthesis pathway. (A) Axon regeneration into the optic tectum is reduced upon hmgcra + hmgcrb knockdown (hmgcra + b-MO), rescued by daily supplementation with mevalonate (MVA), and accelerated by MVA treatment alone. (B) Quantification of axon regeneration in each treatment group. Colored boxes represent p < 0.05 in treated groups compared with the C-MO and/or Vehicle treated group in the corresponding column by two-way ANOVA with Fisher’s LSD post hoc test, n = 5–6 for each group. Scale bar = 500 μm

References

    1. Goldberg JL, Espinosa JS, Xu Y, Davidson N, Kovacs GT, Barres BA. Retinal ganglion cells do not extend axons by default: promotion by neurotrophic signaling and electrical activity. Neuron. 2002;33(5):689–702. - PubMed
    1. Becker T, Becker CG. Axonal regeneration in zebrafish. Curr Opin Neurobiol. 2014;27:186–91. - PubMed
    1. Fuller-Carter PI, Carter KW, Anderson D, Harvey AR, Giles KM, Rodger J. Integrated analyses of zebrafish miRNA and mRNA expression profiles identify miR-29b and miR-223 as potential regulators of optic nerve regeneration. BMC Genomics. 2015;16(1):591. - PMC - PubMed
    1. Veldman MB, Bemben MA, Thompson RC, Goldman D. Gene expression analysis of zebrafish retinal ganglion cells during optic nerve regeneration identifies KLF6a and KLF7a as important regulators of axon regeneration. Dev Biol. 2007;312(2):596–612. - PubMed
    1. McCurley AT, Callard GV. Time course analysis of gene expression patterns in zebrafish eye during optic nerve regeneration. J Exp Neurosci. 2010;2010(4):17–33. - PMC - PubMed

LinkOut - more resources