. 2025 Feb 19:16:1387128.
doi: 10.3389/fphys.2025.1387128. eCollection 2025.

Effects of Th1/Th17 and Th2 cytokines on lipid metabolism in differentiated keratinocytes

Affiliations

Effects of Th1/Th17 and Th2 cytokines on lipid metabolism in differentiated keratinocytes

Alessia Cavallo et al. Front Physiol. .

Abstract

Introduction: Abnormalities of keratinocyte differentiation and impairment of permeability barrier are features of inflammatory skin diseases driven by Th1/Th17 and Th2 immune response, such as psoriasis and atopic dermatitis. We aimed at identifying the signature of the Th1/Th17 and Th2 environments on keratinocytes, focusing on the expression of genes involved in the lipid metabolism and profiles of abundance of lipid metabolites.

Methods: Human immortalized keratinocytes in prodifferentiative conditions induced by increasing calcium concentration, and 3D epidermal equivalents were treated with mixtures either of TNF-α and IL-17A plus Th1-related cytokines (IL-1α, IL-6) or of Th2 cytokines (IL-4, IL-13). The expression of genes involved in epidermal differentiation and lipid metabolism was evaluated by RT-PCR at 2, 4 and 7 days of treatment. The protein levels of early and late keratinocyte differentiation markers were assessed. The lipid composition was investigated by GCMS and LCMS.

Results: Both Th1/Th17 and Th2 cytokine mixtures changed the expression of genes involved in the metabolism of fatty acids (FAs), i.e., FAS, FADS2, SCD1, and ALOX12B. Th1/ Th17 downregulated the ELOVL3 gene, which is implicated in the FAs elongation, while the mRNA levels of ABCA12 and HMGCR, genes involved in lipids transport and cholesterol synthesis, respectively, were decreased with both cytokine mixtures. DEGS1 and DEGS2, key enzymes in the ceramide synthesis, were downregulated and upregulated in the Th1/Th17 and Th2 environments, respectively. The mRNA expression of CERS3, which synthesizes ceramides containing long chain FAs, was increased by Th1/Th17 cytokines. Both Th1/ Th17 and Th2 cytokine mixtures lowered the CERS6 mRNA levels in differentiated keratinocytes. Effects specific to Th1/Th17 or Th2 cytokines were observed on freely extractable cell lipids. Th1/Th17 cytokines significantly inhibited the high calcium-induced synthesis of phospholipids (PCs, PEs, SMs), and short-chain ceramides, while the synthesis of ceramides with medium to long carbon chains was upregulated. Th2 cytokines caused a generalized decrement of free FAs, including long-chain ones. In contrast to 2D cultures, the 3D epidermal equivalents allowed the identification of altered profiles of acyland hexosyl-ceramides.

Conclusion: The different effects exerted by Th1/Th17 and Th2 cytokines support, at least in part, the features of lipid barrier alterations specific to psoriasis or atopic dermatitis.

Keywords: 3D human epidermal equivalent; Th1/Th17 cytokines; Th2 cytokines; epidermal barrier; epidermal lipids; human keratinocytes cell line.


Conflict of interest statement

The authors declare that the research was conducted in the absence of any commercial or financial relationships that could be construed as a potential conflict of interest.

Figures

FIGURE 1
FIGURE 1
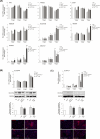
Western blot and corresponding densitometric analysis of K10, IVL, LOR, FLG (monomer, 37 kDa) expression in Ker-CT cells in differentiating conditions with ↑Ca2+ and after treatment with Th1/Th17 (A) and Th2 (B) cytokines at 7 days. GAPDH or HSP70 were used as the endogenous loading controls. Results are expressed as the fold change of the low calcium control cells (Ctr). Data represent the mean ± SD of three independent experiments (significance vs. low calcium control or vs. stimulated cells with ↑Ca2+ are marked with * and °, respectively; *p < 0.05, **p < 0.01 vs. low calcium cells; °p < 0.05, °p < 0.01 vs. differentiated cells). (C) Parallel immunofluorescence analysis of K10, LOR and FLG following stimulation with Th1/Th17 or Th2 cytokine types. Nuclei are counterstained in DAPI. Arrows point at FLG positive cells. Scale bar: 50 μm.
FIGURE 2
FIGURE 2
(A) Quantitative real time PCR analysis of genes involved in the synthesis of FFAs, ceramides and cholesterol in Ker-CT cells treated with ↑Ca2+, ↑Ca2++Th1/Th17 and ↑Ca2++Th2 for 2, 4 and 7 days. All mRNA values were normalized against the expression of GAPDH and were reported relative to low calcium control (Ctr). Data represent the mean ± SD of three independent experiments (significance vs. low calcium control or vs. stimulated cells with ↑Ca2+ are marked with * and °, respectively; *p < 0.05, **p < 0.01 and ***p < 0.001 vs. low calcium cells; °p < 0.05, °p < 0.01 vs. differentiated cells). Results are expressed as fold change relative to the value of cells grown in low calcium, which was set as 1 by definition. Quantitative real time PCR, Western blot with corresponding densitometry, and immunofluorescence analysis of (B) SLC27A4 and (C) ELOVL3 in Ker-CT cells in differentiating conditions with ↑Ca2+ and after treatment with Th1/Th17 and Th2 cytokines at 7 days. All mRNA values were normalized against the expression of GAPDH and were reported relative to low calcium control. Data represent the mean ± SD of three independent experiments (*p < 0.05, ***p < 0.001 vs. low calcium cells; °p < 0.05 vs. differentiated cells). Results are expressed as fold change relative to the value of cells grown in low calcium, which was set as 1 by definition. GAPDH was used as the endogenous loading controls for Western blot analysis. Results are expressed as the fold change respect to low calcium control cells. Data represent the mean ± SD of three independent experiments (*p < 0.05 vs. low calcium cells; °p < 0.05 vs. differentiated cells). Nuclei are counterstained with DAPI. Scale bar: 50 μm.
FIGURE 3
FIGURE 3
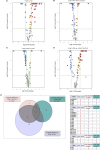
Results of the lipidomic analysis of Ker-CT cells under the different conditions at 7 days. Volcano plots depicting the following paiwise comparisons: (A) ↑Ca2+ vs. low calcium control (Ctr), (B) (↑Ca2++Th1/Th17) vs. ↑Ca2+, (C) (↑Ca2++Th2) vs. ↑Ca2+ (D) (↑Ca2+ +Th2) vs. ↑Ca2+ +Th1/Th17. Each dot corresponds to a lipid species: Blue and red dots indicate species that are statistically (p ≤ 0.05) decreased or increased (FC ≥ 1.5), respectively. Upregulated and downregulated species that did not pass the significance cut-off are in orange and light blue, respectively. Compounds that passed significance p ≤ 0.05 and FC ≥ 1.5 cut-offs are reported in Table 1. (E) Venn diagram and corresponding table showing the number of lipid species commonly and specifically modified by Th1/Th17 and Th2 cytokines.
FIGURE 4
FIGURE 4
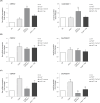
Comparison between gene expression and corresponding synthesized lipid species. Quantitative real time PCR analysis of CERS3 (A), CERS4, (B) CERS6 (C) and respective products in differentiated Ker-CT cells, co-treated with Th1/Th17 or Th2, for 7 days. All mRNA values were normalized against the expression of GAPDH and were expressed relative to low calcium control cells (Ctr). The data are expressed as mean ± SD of three independent experiments (significance vs. low calcium control or vs. stimulated cells are marked with * and °, respectively; *p < 0.05 and **p < 0.01 vs. low calcium control; °p < 0.05 and °p < 0.01 vs. stimulated cells with high calcium).
FIGURE 5
FIGURE 5
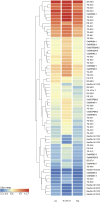
Hierarchical clustering of 64 lipid species, whose abundance was modulated upon treatment with Th1/Th17 or Th2 cytokines of 3D epidermal equivalents. The three columns in the heatmap represent the averaged data of six samples per experimental condition. The color intensity indicates the logarithmically transformed abundances of each lipid species, ranging from dark blue (lowest abundance) to red (highest abundance). The dendrogram supports the identification of shared behaviours and interrelationships among the lipids in the three conditions. The 64 lipid species are listed in cluster order in the Supplementary Table S6.
FIGURE 6
FIGURE 6
Schematic representation of the effects of Th1/Th17 and Th2 cytokines on protein and gene expression, and lipid modifications in differentiated keratinocytes. Blue and dark pink arrows indicate the effects of Th1/Th17 and Th2 cytokine mixtures respectively. The genes of the lipid pathways depicted in the keratinocyte cartoon on the right are in red or in black, respectively, when their expression was modulated or unmodulated by the Th1/Th17 or the Th2 cytokine signals.

References

    1. Akiyama M. (2014). The roles of ABCA12 in epidermal lipid barrier formation and keratinocyte differentiation. Biochim. Biophys. Acta 1841, 435–440. 10.1016/j.bbalip.2013.08.009 - DOI - PubMed
    1. Alessandrini F., Pfister S., Kremmer E., Gerber J., Ring J., Behrendt H. (2004). Alterations of glucosylceramide-beta-glucosidase levels in the skin of patients with psoriasis vulgaris. J. Invest Dermatol 123, 1030–1036. 10.1111/j.0022-202X.2004.23469.x - DOI - PubMed
    1. Alsabbagh M. M. (2024). Cytokines in psoriasis: from pathogenesis to targeted therapy. Hum. Immunol. 85, 110814. 10.1016/j.humimm.2024.110814 - DOI - PubMed
    1. Beckert B., Panico F., Pollmann R., Eming R., Banning A., Tikkanen R. (2019). Immortalized human hTert/KER-CT keratinocytes a model system for research on desmosomal adhesion and pathogenesis of pemphigus vulgaris. Int. J. Mol. Sci. 20, 3113. 10.3390/ijms20133113 - DOI - PMC - PubMed
    1. Berdyshev E., Goleva E., Bronova I., Dyjack N., Rios C., Jung J., et al. (2018). Lipid abnormalities in atopic skin are driven by type 2 cytokines. JCI Insight 3, e98006. 10.1172/jci.insight.98006 - DOI - PMC - PubMed

LinkOut - more resources