Ruxolitinib Delays Nucleus Pulposus Cell Senescence in Rat Intervertebral Discs
- PMID: 40046265
- PMCID: PMC11881815
- DOI: 10.1002/jsp2.70044
Ruxolitinib Delays Nucleus Pulposus Cell Senescence in Rat Intervertebral Discs
Abstract
Background: Intervertebral disc degeneration involves aging and senescence of nucleus pulposus cells (NPCs), and JAK/STAT signaling may contribute to this process. The aim of this study was to investigate the therapeutic effect of the JAK2 inhibitor, ruxolitinib, on NPC senescence.
Methods: Control (third passage), Senescence (sixth passage), JAK inhibitor (ruxolitinib-treated), siRNA-NC (control siRNA-treated), and siRNA-JAK2 (JAK2-targeting siRNA-treated) groups of rat NPCs were established. Cell senescence ratios were determined by β-galactosidase staining and Edu staining was conducted to assess cell proliferation. Cell cycle and apoptosis were analyzed by flow cytometry and Aggrecan and Col II expression detected by immunofluorescence staining. Levels of IL-1β, IL-6, TNF-α, MMP-3, and MMP-13 were detected by ELISA, and p16, p21, p53, p-p53, JAK2, STAT3, p-JAK2, p-STAT3, ADAMTS4, and ADAMTS5 levels were examined by western blot.
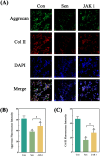
Results: More cell senescence was detected by β-galactosidase staining in the Senescence group than in the Control group, while cell proliferation was lower, apoptosis ratio higher, and the percentage of NPCs in G0/G1 phase higher. Levels of senescence-related proteins, including p16, p21, p53, and p-p53, were higher in the Senescence group than the Control group, as were those of IL-1β, IL-6, TNF-α, MMP-3, MMP-13, ADAMTS4, and ADAMTS5. Further, Aggrecan and Col II levels were lower in the Senescence group, while those of JAK2 and STAT3 (JAK2/STAT3 signaling pathway) were higher. Ruxolitinib reversed the changes described above to varying degrees, and the results were supported by those of experiments involving targeted silencing of JAK2.
Conclusions: NPC senescence is characterized by low cell proliferation, a high apoptosis ratio, cell cycle arrest, and generation of senescence-associated secretory phenotypes. NPC senescence can be delayed by inhibiting JAK2/STAT3 signaling using ruxolitinib.
Keywords: JAK2/STAT3 signaling pathway; nucleus pulposus cells; ruxolitinib; senescence.
© 2025 The Author(s). JOR Spine published by Wiley Periodicals LLC on behalf of Orthopaedic Research Society.
Conflict of interest statement
The authors declare not conflicts of interest.
Figures


Similar articles
-
[Fibulin-3 Regulates Tissue Inhibitor of Metalloproteinases 3 to Inhibit Senescence in Intervertebral Disc Nucleus Pulposus Cells].Sichuan Da Xue Xue Bao Yi Xue Ban. 2024 Sep 20;55(5):1217-1225. doi: 10.12182/20240760604. Sichuan Da Xue Xue Bao Yi Xue Ban. 2024. PMID: 39507955 Free PMC article. Chinese.
-
Inhibition of the P53/P21 Pathway Attenuates the Effects of Senescent Nucleus Pulposus Cell-Derived Exosomes on the Senescence of Nucleus Pulposus Cells.Orthop Surg. 2021 Apr;13(2):583-591. doi: 10.1111/os.12886. Epub 2020 Dec 13. Orthop Surg. 2021. PMID: 33314719 Free PMC article.
-
α-Ketoglutaric acid ameliorates intervertebral disk degeneration by blocking the IL-6/JAK2/STAT3 pathway.Am J Physiol Cell Physiol. 2023 Oct 1;325(4):C1119-C1130. doi: 10.1152/ajpcell.00280.2023. Epub 2023 Sep 4. Am J Physiol Cell Physiol. 2023. PMID: 37661920
-
[Resveratrol regulate the extracellular matrix expression via Wnt/β-catenin pathway in nucleus pulposus cells].Zhongguo Xiu Fu Chong Jian Wai Ke Za Zhi. 2018 Apr 15;32(4):476-483. doi: 10.7507/1002-1892.201709097. Zhongguo Xiu Fu Chong Jian Wai Ke Za Zhi. 2018. PMID: 29806307 Free PMC article. Chinese.
-
[Effect of silencing p53 and p21 on delaying senescence of nucleus pulposus cells].Zhongguo Xiu Fu Chong Jian Wai Ke Za Zhi. 2012 Jul;26(7):796-802. Zhongguo Xiu Fu Chong Jian Wai Ke Za Zhi. 2012. PMID: 22905613 Chinese.
References
-
- Knezevic N. N., Candido K. D., Vlaeyen J. W. S., Van Zundert J., and Cohen S. P., “Low Back Pain,” Lancet 398, no. 10294 (2021): 78–92. - PubMed
-
- Song C., Zhou Y., Cheng K., et al., “Cellular Senescence ‐ Molecular Mechanisms of Intervertebral Disc Degeneration From an Immune Perspective,” Biomedicine & Pharmacotherapy 162 (2023): 114711. - PubMed
LinkOut - more resources
Full Text Sources
Research Materials
Miscellaneous

