. 2025 Feb 21;7(2):fcaf078.
doi: 10.1093/braincomms/fcaf078. eCollection 2025.

Biological signatures in the Alzheimer's continuum discriminate between diagnosis-related and -unrelated associations to ATN categories

Affiliations

Biological signatures in the Alzheimer's continuum discriminate between diagnosis-related and -unrelated associations to ATN categories

Vilma Alanko et al. Brain Commun. .

Abstract

Alzheimer's disease and related dementias have a multifactorial aetiology and heterogeneous biology. The current study aims to identify different biological signatures in a deeply phenotyped memory clinic patient population. In this cross-sectional study, we analysed 49 pre-specified proteins using a multiplex antibody-based suspension bead array in 278 CSF samples from the real-world research database and biobank at the Karolinska University Hospital Memory Clinic, Solna, Sweden. Patients with a clinical diagnosis of subjective cognitive decline (N = 151), mild cognitive impairment (N = 61), Alzheimer's disease (N = 47), or other diagnoses (N = 19; vascular dementias, alcohol-related dementia, unspecified dementias, or other amnesias) were included. Principal component analyses were performed, and resulting principal components (PCs) were tested for associations with clinical variables and Alzheimer's disease biomarkers (CSF biomarkers beta-amyloid 42, beta-amyloid 42/40, phosphorylated tau 181, phosphorylated tau 181/beta-amyloid 42). PC 1 (explaining 52% of the variance between patients) was associated with the clinical Alzheimer's disease CSF biomarkers beta-amyloid 42, phosphorylated tau 181, and total tau but not with Alzheimer's disease-related neurodegeneration imaging markers, cognitive performance, or clinical diagnosis. PC 2 (explaining 9% of the variance) displayed an inflammatory profile with high contributions of chitinase 3 like 1 (CHI3L1) and triggering receptor expressed on myeloid cells 2 (TREM2) and significant correlation to CSF free light chain kappa. In contrast to PC 1, PC 3 (explaining 5% of the variance) showed associations with all the clinical Alzheimer's disease CSF biomarkers, the imaging markers, cognitive impairment and clinical diagnosis. Serpin family A member 3 (SERPINA3), chitinase 1 (CHIT1), and neuronal pentraxin 2 (NPTX2) contributed most to PC 3. PC 4 (explaining 4% of the variance) exhibited an inflammatory profile distinct from PC 2, with the largest contributions from TREM2, leucine-rich alpha-2-glycoprotein 1 (LRG1) and complement C9. The component was associated with peripheral inflammation. We found that CSF protein profiles in a memory clinic cohort reflect molecular differences across diagnostic groups. Our results emphasize that real-world memory clinic patients can have different ongoing biological processes despite receiving the same diagnosis. In the future, this information could be utilized to identify patient endotypes and uncover precision biomarkers and novel therapeutic targets.

Keywords: Alzheimer's disease; biomarkers; biosignature; cognition; protein profiling.


Conflict of interest statement

M.K. has served on scientific advisory boards at Biogen, Roche, Combinostics and Swedish Care International and given lectures in symposia sponsored by Biogen, Roche, Nutricia, Lundbeck and Nestlé. All other authors reported no biomedical financial interests or potential conflicts of interest.

Figures

Graphical Abstract
Graphical Abstract
Figure 1
Figure 1
The PCA reveals variance between patients based on CSF protein profile. PCA was performed using centred and scaled protein level data from 49 proteins measured in CSF samples from a memory clinic cohort with 278 patients. Biplots of (A) PCs 1 and 2, and (B) 3 and 4 where the large points indicate the mean for each diagnostic group and each small data point represents a patient (SCD N = 151; MCI N = 61; AD N = 47; Other N = 19). The direction and strengths of variable contributions are visualized in correlation circle biplots for (C) PC 1 and PC 2, and (D) PC 3 and PC 4. Each protein is represented by an arrow. (E–H) Protein contributions (%) to each of the four PCs. The red dashed line indicates the level (2.04%) if all proteins contributed equally. A list of the protein names is given in Supplementary Table 1. AD, Alzheimer’s disease; MCI, mild cognitive impairment; Other, other dementias/amnesias; SCD, subjective cognitive decline.
Figure 2
Figure 2
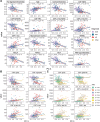
PC 1 is correlated with three Alzheimer’s disease markers. (A) Significant correlations (Spearman’s rank correlation) were observed between PC 1 and Aβ42 (pg/mL; N = 277), p-tau181 (pg/mL; N = 277) and t-tau (pg/mL; N = 277). (B) When stratified by diagnosis [SCD N = 151; MCI N = 60; AD N = 47; Other N = 19], the correlations remained significant (Supplementary Table 3B) and had the same directions. (C) Stratification by ATN category (A–T–N– N = 146; A–T–N+ N = 30; A–T+N– N = 4; A–T+N+ N = 5; A+T–N– N = 14; A+T–N+ N = 6; A+T+N– N = 47; A+T+N+ N = 20) revealed similar correlations between most of the categories. Only correlations with a significance level of P < 0.0001 (unadjusted) are shown and the plotted trendlines were acquired by robust linear regressions. Each data point represents a patient and is annotated by the diagnostic group or ATN category. Aβ, beta-amyloid; AD, Alzheimer’s disease; ATN categories, (A) beta-amyloid, (T) p-tau, (N) neurodegeneration (+) positive or (−) negative; MCI, mild cognitive impairment; Other, other dementias/amnesias; p-tau, phosphorylated tau; SCD, subjective cognitive decline; t-tau, total tau.
Figure 3
Figure 3
PC 2 is weakly correlated with CSF albumin and FLC-K. PC 2 was significantly correlated (Spearman’s rank correlation) with CSF albumin levels (mg/L; N = 241), albumin quotient (N = 258) and FLC-K (mg/L; N = 238). Only correlations with a significance level of P < 0.01 (unadjusted) are shown and the plotted trendlines were acquired by robust linear regressions. Each data point represents a patient and is annotated by the diagnostic group. Two data points were removed from the FLC-K plot for visual purposes: FLC-K 28 mg/L, PC 2 –1.44 (SCD, A–T–N+), FLC-K 11 mg/L, PC 2 2.54 (SCD, A–T–N–). AD, Alzheimer’s disease; FLC-K, free light chain kappa; MCI, mild cognitive impairment; Other, other dementias/amnesias; SCD, subjective cognitive decline.
Figure 4
Figure 4
PC 3 reflects Alzheimer’s disease pathology and cognitive impairment. (A) Significant correlations (Spearman’s rank correlation) between PC 3 and all Alzheimer’s disease CSF biomarkers (Aβ42 N = 277; Aβ42/40 N = 277; p-tau/Aβ42 N = 277; p-tau181 N = 277), CSF markers of neuronal injury (NfL N = 272; t-tau N = 277), MRI measures of neurodegeneration (AD signature thickness, cortical thickness, hippocampal volume and WM hypointensities all N = 189), cognitive test scores (KOD N = 162; MMSE N = 187; MoCA N = 234; RAVLT N = 172; RCF N = 163) and age (N = 278). Units for the CSF variables are indicated in Table 1. (B) Correlations between CSF Alzheimer’s disease biomarkers and PC 3 were stratified by diagnosis [SCD N = 151 (NfL N = 147); MCI N = 60; AD N = 47 (NfL N = 46); Other N = 19]. The correlations remained significant only for some of the diagnostic groups (Supplementary Table 3B). (C) CSF Alzheimer’s disease biomarker correlations stratified by ATN category (A–T–N– N = 146; A–T–N+ N = 30; A–T+N– N = 4; A–T+N+ N = 5; A+T–N– N = 14; A+T–N+ N = 6; A+T+N– N = 47; A+T+N+ N = 20) displayed divergent relationships among the categories (Supplementary Table 3B). Only correlations with a significance level of P < 0.0001 (unadjusted) are shown and the plotted trendlines were acquired by robust linear regressions. Each data point represents a patient and is annotated by the diagnostic group or ATN category. Aβ; beta-amyloid; AD, Alzheimer's disease; ATN categories, (A) beta-amyloid, (T) p-tau, (N) neurodegeneration (+) positive or (−) negative; KOD, Digit Symbol-Coding test; MCI, mild cognitive impairment; MMSE, Mini Mental State Examination; MoCA, Montreal Cognitive Assessment; NfL, neurofilament light; Other, other dementias/amnesias; RAVLT, Rey Auditory Verbal Learning Test; RCF, Rey Complex Figure memory test; p-tau, phosphorylated tau; SCD, subjective cognitive decline; t-tau, total tau; WM, white matter.
Figure 5
Figure 5
PC 4 is associated with markers of peripheral inflammation. PC 4 was significantly correlated (Spearman’s rank correlation) with erythrocyte SR (mm; N = 239), haemoglobin (g/L; N = 242) and both plasma and serum albumin (g/L; N = 243 and 242, respectively). Only correlations with a significance level of P < 0.0001 (unadjusted) are shown and the plotted trendlines were acquired by robust linear regressions. Each data point represents a patient and is annotated by the diagnostic group. AD, Alzheimer’s disease; MCI, mild cognitive impairment; Other, other dementias/amnesias; SCD, subjective cognitive decline; SR, sedimentation rate.

References

    1. Boyle PA, Yu L, Leurgans SE, et al. Attributable risk of Alzheimer’s dementia attributed to age-related neuropathologies. Ann Neurol. 2019;85(1):114–124. - PMC - PubMed
    1. Kapasi A, DeCarli C, Schneider JA. Impact of multiple pathologies on the threshold for clinically overt dementia. Acta Neuropathol. 2017;134(2):171–186. - PMC - PubMed
    1. Murray ME, Graff-Radford NR, Ross OA, Petersen RC, Duara R, Dickson DW. Neuropathologically defined subtypes of Alzheimer’s disease with distinct clinical characteristics: A retrospective study. Lancet Neurol. 2011;10(9):785–796. - PMC - PubMed
    1. Mattsson-Carlgren N, Grinberg LT, Boxer A, et al. Cerebrospinal fluid biomarkers in autopsy-confirmed Alzheimer disease and frontotemporal lobar degeneration. Neurology. 2022;98(11):e1137–e1150. - PMC - PubMed
    1. Modeste ES, Ping L, Watson CM, et al. Quantitative proteomics of cerebrospinal fluid from African Americans and Caucasians reveals shared and divergent changes in Alzheimer’s disease. Mol Neurodegener. 2023;18(1):48. - PMC - PubMed

LinkOut - more resources