. 2025 Apr 7;224(4):e202410013.
doi: 10.1083/jcb.202410013. Epub 2025 Mar 6.

Any1 is a phospholipid scramblase involved in endosome biogenesis

Affiliations

Any1 is a phospholipid scramblase involved in endosome biogenesis

Jieqiong Gao et al. J Cell Biol. .

Abstract

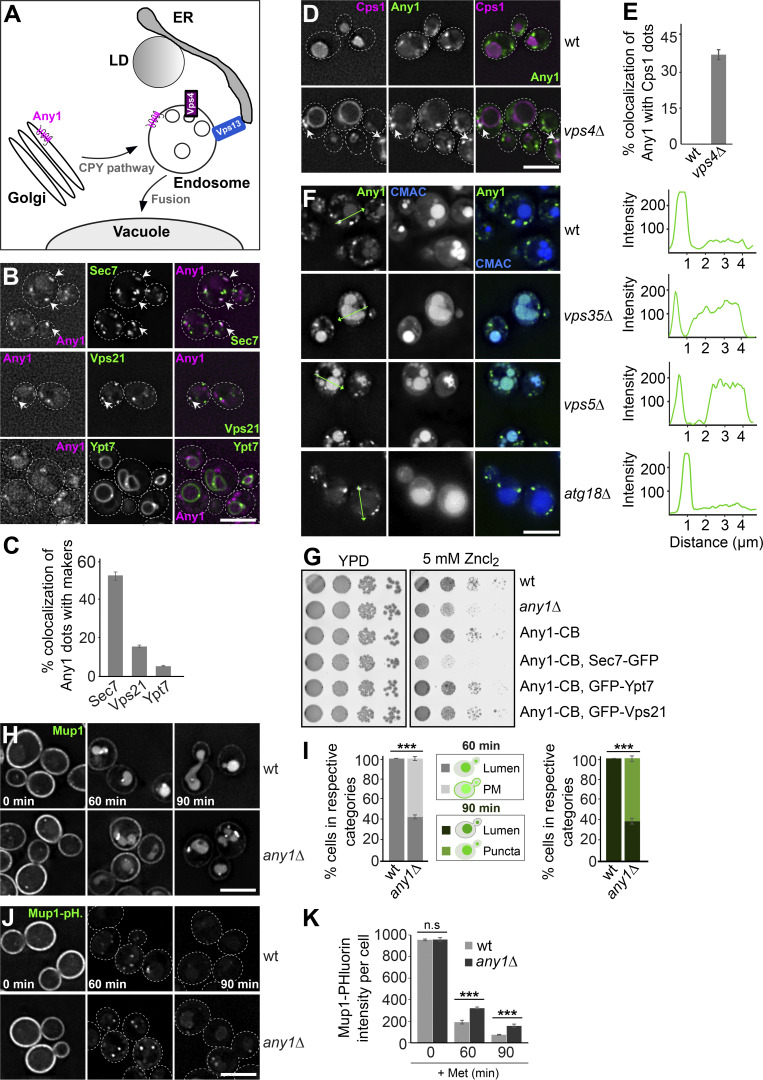
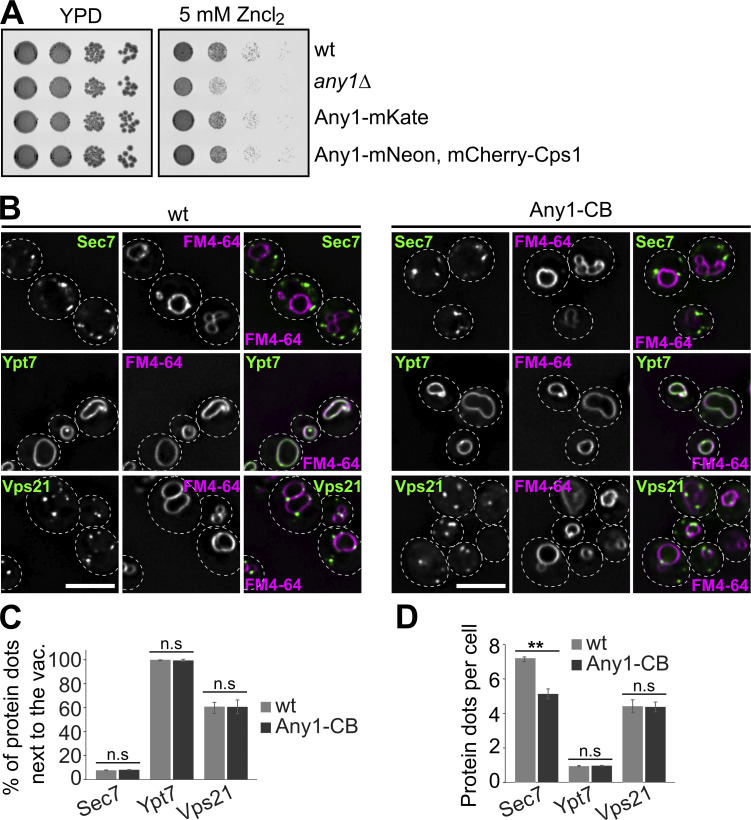
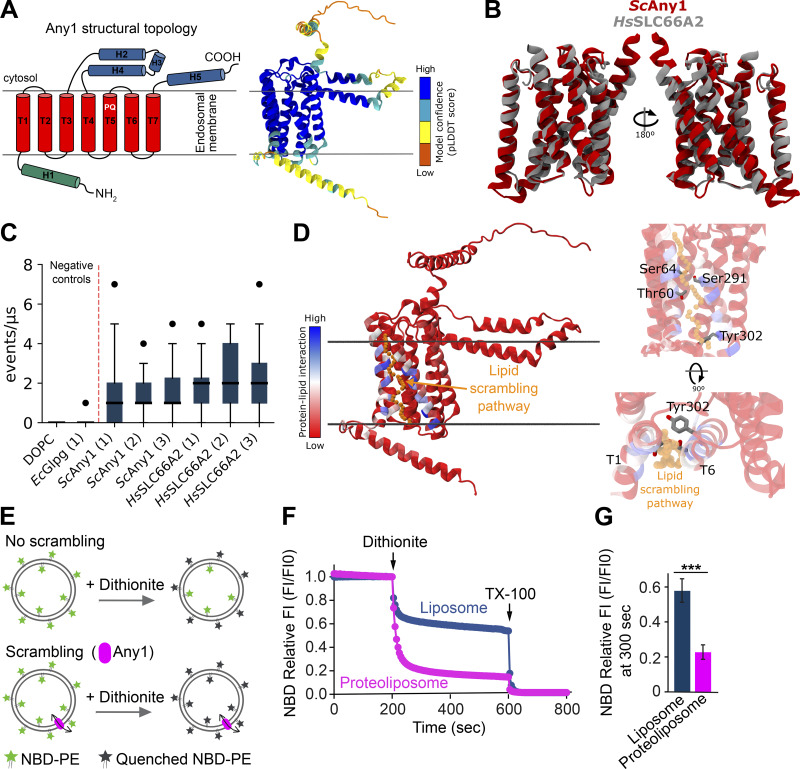
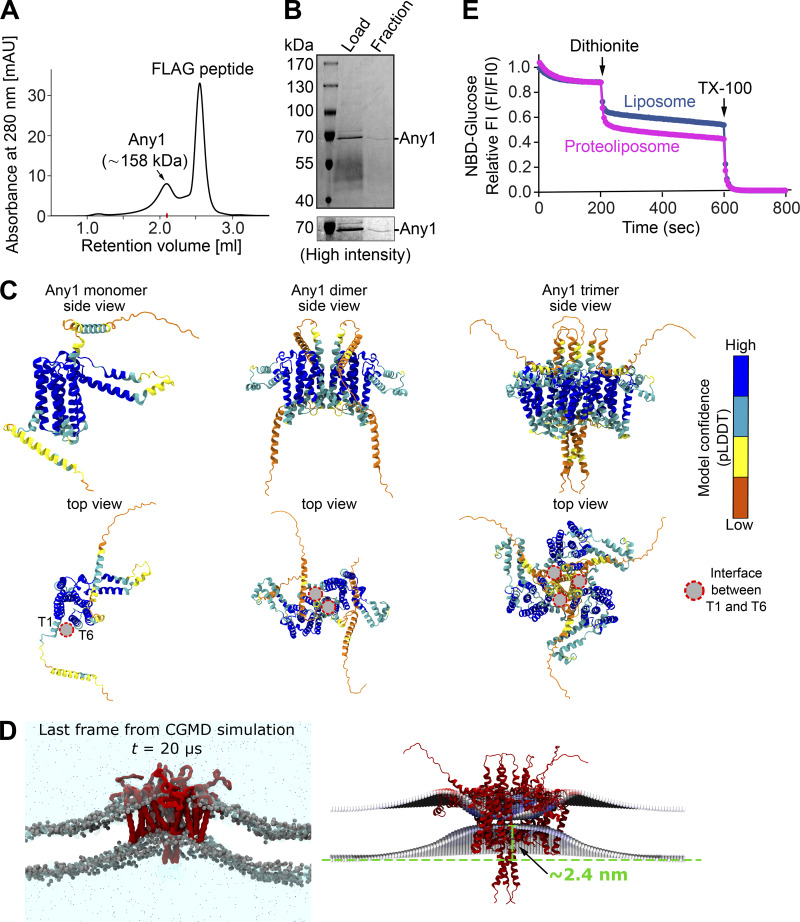
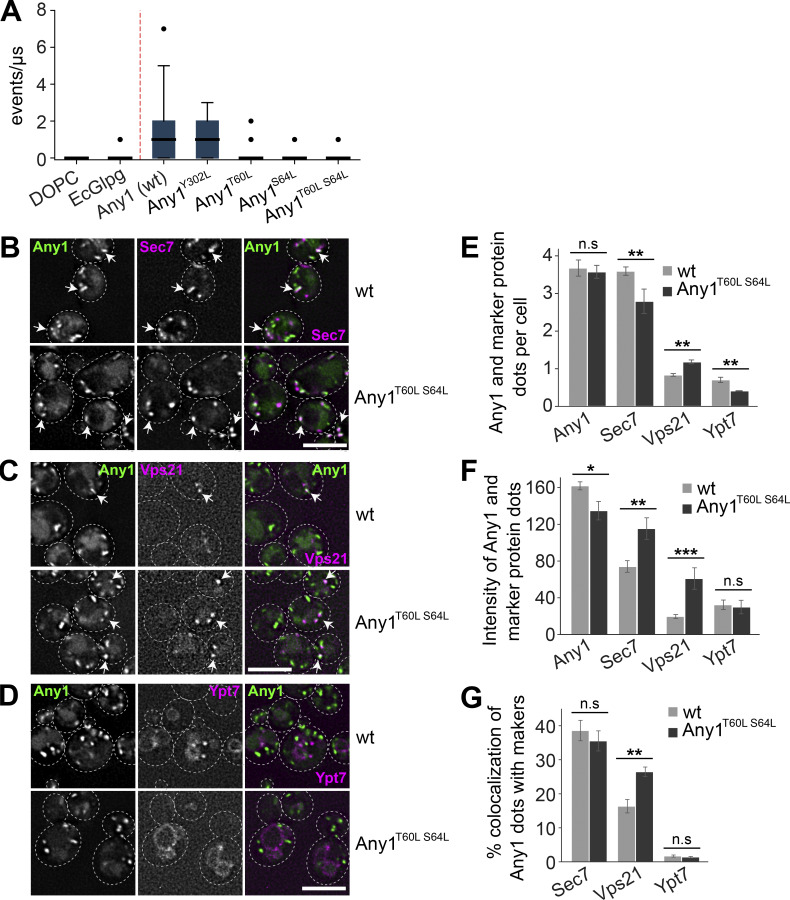
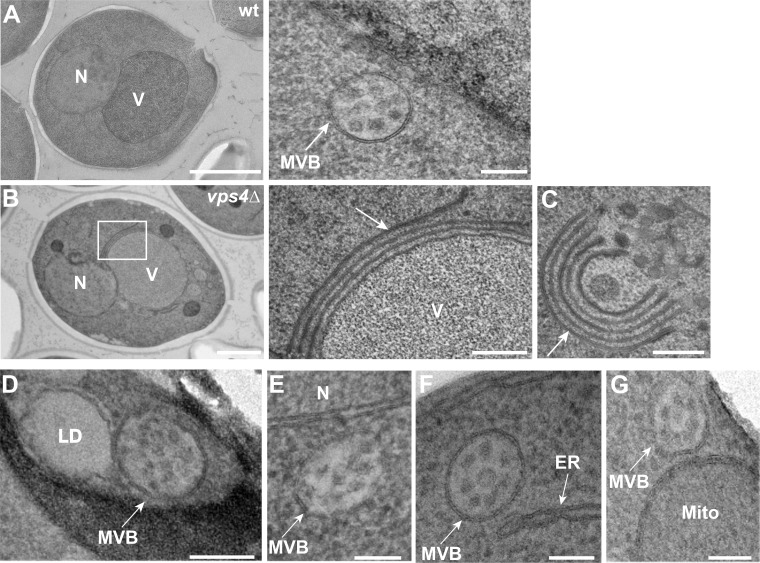
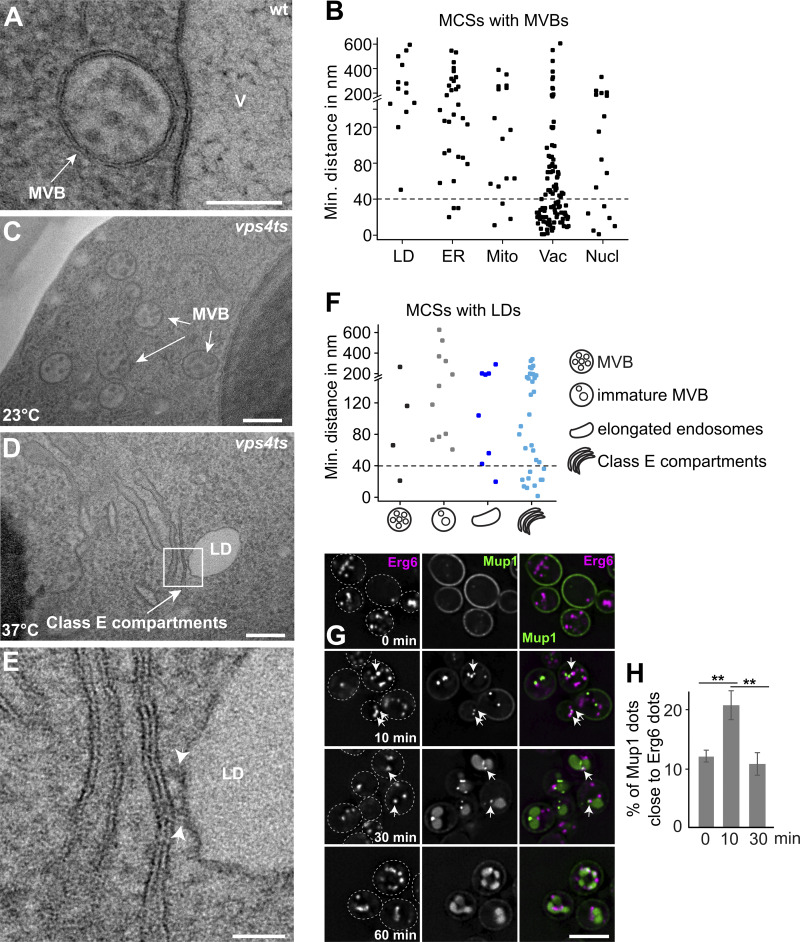
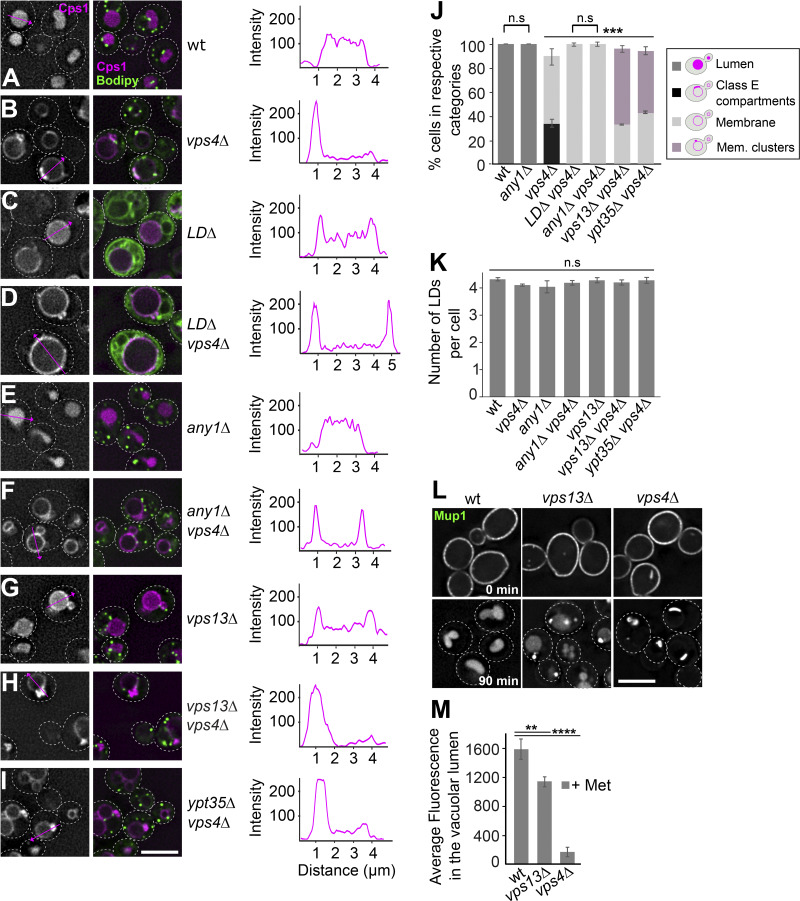
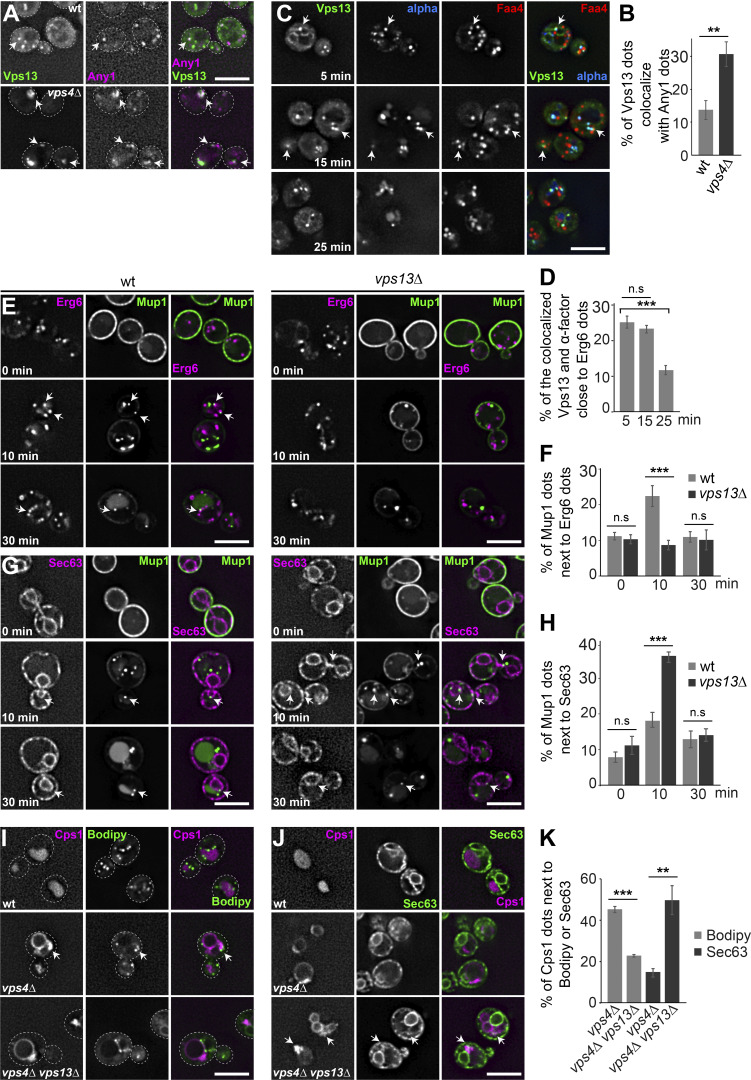
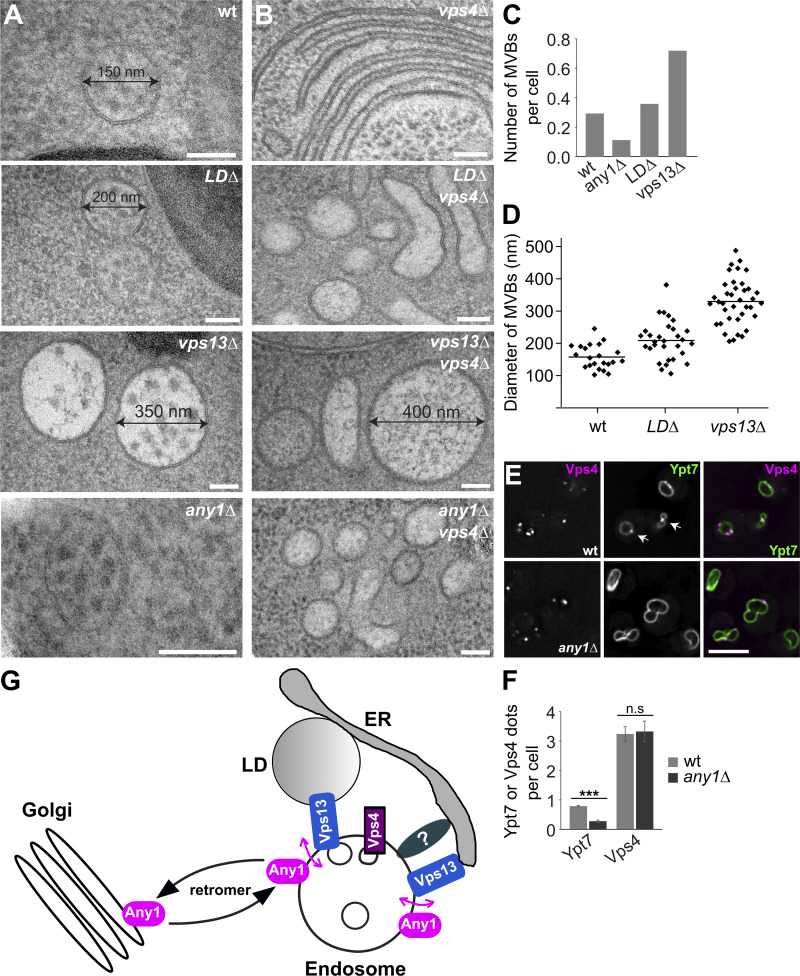
Endosomes are central organelles in the recycling and degradation of receptors and membrane proteins. Once endocytosed, such proteins are sorted at endosomes into intraluminal vesicles (ILVs). The resulting multivesicular bodies (MVBs) then fuse with the lysosomes, leading to the degradation of ILVs and recycling of the resulting monomers. However, the biogenesis of MVBs requires a constant lipid supply for efficient ILV formation. An ER-endosome membrane contact site has been suggested to play a critical role in MVB biogenesis. Here, we identify Any1 as a novel phospholipid scramblase, which functions with the lipid transfer protein Vps13 in MVB biogenesis. We uncover that Any1 cycles between the early endosomes and the Golgi and colocalizes with Vps13, possibly at a here-discovered potential contact site between lipid droplets (LDs) and endosomes. Strikingly, both Any1 and Vps13 are required for MVB formation, presumably to couple lipid flux with membrane homeostasis during ILV formation and endosome maturation.


Conflict of interest statement

Disclosures: The authors declare no competing interests exist.

Figures

Figure 1.
Figure 1.
Any1 cycles between the Golgi and early endosomes. (A) Working model of Any1 trafficking. For details see text. (B) Localization of Any1 relative to Sec7, Vps21, and Ypt7. Cells expressing mKate-tagged Any1 and GFP-tagged Sec7, Vps21, or Ypt7 were grown in a synthetic medium and analyzed by fluorescence microscopy, and individual slices are shown. Scale bar, 5 µm. (C) The percentage of Any1 puncta colocalizing with Sec7, Vps21, or Ypt7 was determined. Any1 dots (n ≥ 600), Sec7 dots (n ≥ 900), Vps21 dots (n ≥ 600), and Ypt7 dots (n ≥ 200) were quantified using a custom graphical user interface based on ImageJ built-in routines (Arlt et al., 2015; Gao et al., 2018). Single cells were segmented from bright-field images, and protein dot signals were identified on sum projections of deconvolved image stacks. Colocalization was assessed by counting particles with >50% overlapping area, with manual corrections to reduce background artifacts. Error bars represent standard deviation (SD). Bar graphs represent averages from three independent experiments. (D) Localization of Any1 relative to Cps1 in wild-type and vps4Δ cells. Cells expressing mNeon-tagged Any1 and mCherry-tagged Cps1 were grown in a synthetic medium and analyzed by fluorescence microscopy, and individual slices are shown. Scale bar, 5 µm. (E) Percentage of Any1 puncta colocalizing with Cps1 dots. Any1 dots (n ≥ 500) and Cps1 dots (n ≥ 80) were quantified by Image J as described in Fig. 1 C. Error bars represent standard deviation (SD). Bar graphs represent averages from three independent experiments. (F) Localization of Any1 in wild-type, vps35Δ, vps5Δ, and atg18Δ cells. Cells expressing mNeon-tagged Any1 were grown in a synthetic medium and vacuoles were stained with CMAC. Cells were analyzed by fluorescence microscopy and individual slices are shown. Scale bar, 5 µm. The line profiles on the right show the fluorescence of Any1-mNeon signal along the green lines indicated in the images. (G) Growth assay on ZnCl2-containing plates. The indicated cells were grown in synthetic medium, spotted onto plates containing YPD with or without 5 mM Zn2+, and grown at 30°C for 2–3 days. (H) The sorting of Mup1-GFP in wild-type and any1Δ cells. Cells expressing Mup1-GFP were grown in the absence of methionine (0 min) in a minimal medium to an OD600 of 0.8. Then methionine was added, and cells were analyzed by fluorescence microscopy after 60 or 90 min. The individual slices are shown. Scale bar, 5 µm. (I) Quantification of Mup1-GFP sorting from H. Cells (n ≥ 150) were quantified by Image J. Bar graphs represent averages from three independent experiments. Error bars represent standard deviation (SD). ***, P < 0.001 (two-tailed Student’s t test). (J) Sorting of Mup1-pHluorin in wild-type and any1Δ cells. Cells were analyzed under the same growth conditions and procedures as described in Fig. 1 H. (K) Quantification of Mup1-pHluorin intensity per cell. Cells (n ≥ 150) were quantified by ImageJ. The analysis involved adjusting the threshold, creating a mask, and measuring the intensity within selected areas. Bar graphs represent averages from three independent experiments. Error bars represent standard deviation (SD). ns, > 0.05; ***, P < 0.001 (two-tailed Student’s t test).
Figure S1.
Figure S1.
Localization of Sec7, Ypt7, and Vps21 in cells expressing Any1-CB. (A) Growth assay on ZnCl2-containing plates. The indicated cells were grown in synthetic medium, spotted onto plates containing YPD with or without 5 mM Zn2+, and grown at 30°C for 2–3 days. (B) Localization of Sec7, Ypt7, and Vps21 relative to the vacuoles in wild-type and Any1-CB cells. Cells expressing GFP-tagged Sec7 or Vps21 or Ypt7 or with chromobody-tagged (CB) Any1 were grown in a synthetic medium and analyzed by fluorescence microscopy, and individual slices are shown. Scale bar, 5 µm. (C and D) Quantification of the localization and number of Sec7, Ypt7 and Vps21 from A. Sec7 dots (n ≥ 900), Vps21 dots (n ≥ 900), and Ypt7 dots (n ≥ 200) were quantified by Image J. The number of Sec7, Ypt7, and Vps21 dots was counted manually from a sum projection. Bar graphs represent the averages from three independent experiments. Error bars represent standard deviation (SD). ns, > 0.05; **, P < 0.01 (two-tailed Student’s t test).
Figure 2.
Figure 2.
Any1 has phospholipid scramblase activity in silico and in vitro. (A). Left: Secondary structure topology of the yeast Any1 (ScAny1) protein. The luminal, transmembrane, and cytosolic helices are colored in green, red, and blue, respectively; The PQ-loop motif is highlighted. Right: Predicted structural model by AlphaFold2 for the ScAny1 protein colored by its confidence prediction. (B) Structural alignment of the transmembrane segments of ScAny1 (red) and HsSLC66A2 (gray) proteins. (C) In silico lipid scrambling assay from CG-MD simulations for different oligomerizations (number in parentheses) of both ScAny1 and HsSLC66A2. The values for the negative controls (DOPC pure membrane and EcGlpG) are taken from Li et al. (2024a). The blue boxes represent the interquartile range while the solid black line inside each box represents the median of the data. The minimum and maximum data are shown with whiskers and outliers are shown as black dots. Each data point represents the total sum of events that occurred per microsecond as mentioned in Materials and methods. Each boxplot contains 36 data points corresponding to 18 μs production runs over two replicas after omitting the first 2 μs for equilibration from each trajectory. (D) Main amino acids involved in the in silico lipid scrambling activity of ScAny1. Blue indicates a high contribution to lipid scrambling, red indicates no contribution to lipid scrambling. Right, top, and side views of the main polar residues involved in the lipid scrambling. (E–G) Fluorescence-based lipid scramblase assay of Any1. (E) Schematic representation of the scramblase assay. (F) NBD relative fluorescence during the scrambling assay (details of the assay are described in Materials and methods). (G) Quantification of fluorescent signal from F. Bar graphs represent averages from three independent experiments. Error bars represent SD of three independent experiments. ***, P < 0.001 (two-tailed Student’s t test).
Figure S2.
Figure S2.
Access of liposome enclosed 2-NBDG to dithionite. (A) Size exclusion chromatography (SEC) of affinity-purified Any1. Purification was done as described in Materials and methods. (B) Purified Any1. Proteins were from affinity purification (eluate, left) and SEC (right). (C) Best structural models for the monomer, dimer, and trimer of ScAny1 predicted with AlphaFold2. The models are colored by their Predicted local-distance difference test (pLDDT) confidence score. (D) Membrane curvature induced by the trimeric structure of ScAny1. Right, representative screenshot of the last frame from one of the replicas for ScAny1 simulations. The protein is shown as a red surface, the phosphate beads are shown as gray spheres, and the NaCl solution is shown as a cyan shadow with the ions as dots. Left, membrane curvature analysis was performed with the g_lomepro tool. An estimated elevation in the lower membrane leaflet of ∼2.5 nm was obtained. (E) 2-NBDG protection assay. The fluorescence of 2-NBDG captured in liposomes or proteoliposomes (protein: phospholipid ratio = 1:1,500) was measured over time, and the permeability of the membrane was assessed by the addition of 30 mM sodium dithionite, followed by the addition of 0.1% of Triton X-100. Source data are available for this figure: SourceData FS2.
Figure 3.
Figure 3.
The predicted scrambling pathway is critical for Any function. (A) In silico lipid scrambling assay of Any1 mutants. The values for the negative controls (DOPC pure membrane and EcGlpG) are taken from Li et al. (2024a). The blue boxes represent the interquartile range while the solid black line inside each box represents the median of the data. The minimum and maximum data are shown with whiskers and outliers are shown as black dots. Each data point represents the total sum of events that occurred per microsecond as mentioned in Materials and methods. Each boxplot contains 36 data points corresponding to 18-μs production runs over two replicas, after omitting the first 2-μs for equilibration from each trajectory. (B–D) Localization of Any1 wild-type and mutant relative to Sec7, Vps21, and Ypt7. Plasmids encoding for Any1-mNeon wild-type and mutant proteins under the control of its endogenous promoter were expressed in any1∆ cells. These cells also expressed mScarlet-tagged Sec7, mCherry-tagged Vps21, or Ypt7 and were grown in a synthetic medium. They were analyzed by fluorescence microscopy. Images show individual slices. Scale bar, 5 µm. (E and F) Quantification of the number and intensity of Sec7, Vp21 and Ypt7 dots. The number of dots was counted manually from a sum projection. The intensity analysis of fluorescent dots involved adjusting the threshold, creating a mask, and measuring the intensity within selected areas. Bar graphs represent averages from three independent experiments. Error bars represent standard deviation (SD). ns, > 0.05; **, P < 0.01, ***, P < 0.001 (two-tailed Student’s t test). (G) Percentage of Any1 puncta colocalizing with Sec7, Vps21, or Ypt7 was determined. Any1 dots (n ≥ 600), Sec7 dots (n ≥ 600), Vps21 dots (n ≥ 200), and Ypt7 dots (n ≥ 100) were quantified using a custom graphical user interface based on ImageJ built-in routines as described in Fig. 1 C. Bar graphs represent averages from three independent experiments. ns, > 0.05; **, P < 0.01 (two-tailed Student’s t test).
Figure S3.
Figure S3.
Endosome proximity to selected organelles. (A–C) Representative ultrastructure images of the endosomes in wild-type cells (A) and Class E compartments in vps4Δ cells. (B) Scale bar, 1 µm. (C) Scale bar, 100 nm. (D–G) Examples of MCSs between endosomes and LD or nucleus or ER or mitochondria by TEM. Scale bar, 100 nm.
Figure 4.
Figure 4.
Lipid droplets are in close proximity to endosomes. (A) Analysis of MCSs between the endosomes and LD or ER or mitochondria or vacuoles or nucleus by transmission electron microscopy in wild-type cells. Scale bar, 100 nm. (B) Quantification of the distance between LDs or ER or mitochondria (Mito) or vacuoles (Vac) or nuclei (Nucl) from A (n = 118 cells). (C–E) Analysis of MCSs between LDs and endosomal structures in vps4 ts mutant cells. vps4 ts cells were grown at 23°C in a synthetic medium and then shifted or not to 37°C for 2 h. Scale bars, 200 nm (C and D), 50 nm (E). (F) Quantification of the distance between LDs and the intermediate endosomal structures in vps4 ts cells at 37°C for 2 h (n = 87). (G) Localization of Mup1 relative to Erg6. Cells expressing GFP-tagged Mup1 and mKate-tagged Erg6 were grown in the absence of methionine (0 min) in a minimal medium to an OD600 of 0.8. Then methionine was added and cells were analyzed by fluorescence microscopy after 10, 30, and 60 min. Scale bar, 5 µm. (H) A fraction of Mup1 puncta partially overlaps with Erg6 dots. Mup1 dots (n ≥ 200) were quantified by Image J. Quantification was conducted as described in Fig. 1 C. The proximity between Erg6 and Mup1 dots was evaluated by counting particles with >10% overlapping area. Bar graphs represent averages from three independent experiments. Error bars represent standard deviation (SD). **, P < 0.01 (two-tailed Student’s t test).
Figure S4.
Figure S4.
LDs localization relative to the endosomal class E compartment. (A) Analysis of the ultrastructure of the endosomes (left), and MCSs between LDs and class E compartments (right) in vps4 ts mutant cells. vps4 ts cells were grown at 23°C in a synthetic medium, and then shifted to 37°C for 30 or 60 min. Scale bar, 200 nm. (B and G) Percentage of cells containing different endosomal structures (B) or quantification of number of LDs (G) in wild-type and vps4 ts mutant cells. Cells were grown in synthetic medium at 23°C and then shifted to or not shifted to 37°C for 30 or 60 min, or vps4 ts mutant cells were shifted to 37°C for 120 min. wt, 0 min: number of cells (n) = 96; 60 min: n = 60; vps4 ts, 0 min: n = 111; 60 min: n = 81; 120 min: n = 87 were quantified. (C–F) Quantification of the distance between the intermediate endosomal structures and LDs or ER or mitochondria or vacuoles or nuclei in vps4 ts cells at 37°C for 2 h from A. A total of 87 cells were quantified.
Figure 5.
Figure 5.
LDs and Vps13 are important for efficient endolysosomal protein trafficking. (A–I) Sorting of Cps1 in wild-type and mutant cells. Cells expressing mCherry-tagged Cps1 were grown in a synthetic medium with LDs stained with Bodipy 493/503 (green) and analyzed by fluorescence microscopy. Representative slides are shown. Scale bar, 5 µm. The line profiles on the right show the fluorescence of mCherry-Cps1 signal along the magenta lines indicated in the images. (J) Quantification of Cps1 sorting from A–I. Cells (n ≥ 200) were quantified by Image J. Bar graphs represent averages from three independent experiments. Error bars represent standard deviation (SD). ns, > 0.05; ***, P < 0.001 (two-tailed Student’s t test). (K) Quantification of the number of LDs from A, B, and E–I. Cells (n ≥ 200) were quantified by ImageJ. The number of LDs was counted manually from a sum projection. Bar graphs represent averages from three independent experiments. Error bars represent standard deviation (SD). ns, > 0.05 (two-tailed Student’s t test). (L) Sorting of Mup1 in wild-type, vps13Δ, and vps4Δ cells. Cells expressing GFP-tagged Mup1 in the absence of methionine (0 min) in minimal medium to an OD600 of 0.8. Methionine was then added and cells were analyzed by fluorescence microscopy after 90 min. Scale bar, 5 µm. (M) Quantification of Mup1 sorting from J. Cells (n ≥ 100) were quantified by Image J using the region of interest manager tool. Bar graphs represent averages from three independent experiments. Error bars represent standard deviation (SD). **, P < 0.01; ***, P < 0.001 (two-tailed Student’s t test).
Figure 6.
Figure 6.
Vps13 supports crosstalk between the endosomes and LDs. (A) Localization of Vps13 relative to Any1 in wild-type and vps4Δ cells. Cells expressing mNeon-tagged Vps13 and mKate-tagged Any1 were grown in a synthetic medium and analyzed by fluorescence microscopy, and individual slides are shown. Scale bar, 5 µm. (B) Percentage of Vps13 puncta colocalizing with Any1 dots. Vps13 dots (n ≥ 150) and Any1 dots (n ≥ 300) were quantified by Image J as described in Fig. 1 C. Bar graphs represent averages from three independent experiments. Error bars represent standard deviation (SD). **, P < 0.01 (two-tailed Student’s t test). (C) Localization of Vps13 relative to α-factor and Faa4. Cells expressing mNeon-tagged Vps13 and mScarlet-tagged Faa4 were grown in a synthetic medium, cooled to 4°C to block endocytosis, and treated with fluorescent α-factor for 15 min at 4°C. Cells were analyzed by fluorescence microscopy after being shifted to 23°C for the indicated time points. Individual slides are shown. Scale bar, 5 µm. (D) Percentage of the colocalized Vps13 and α-factor dots partially overlapped with Erg6 dots. Vps13 dots (n ≥ 400) and α-factor dots (n ≥ 200) were quantified by Image J as described in Fig. 1 C and Fig. 3 H. Bar graphs represent averages from three independent experiments. Error bars represent standard deviation (SD). ns, > 0.05; ***, P < 0.001 (two-tailed Student’s t test). (E and G) Localization of Mup1 relative to Erg6 in wild-type and vps13Δ cells. Cells expressing Mup1-GFP and Erg6-mKate or Sec63-mCherry were grown in the absence of methionine (0 min) in a minimal medium to an OD600 of 0.8. Methionine was added, and cells were analyzed by fluorescence microscopy after 10- or 30-min. Individual slices are shown. Scale bar, 5 µm. (F and H) Mup1 puncta that partially overlap with Erg6 dots or Sec63. Mup1 dots (n ≥ 200) were quantified by Image J as described in Fig. 1 C and Fig. 3 H. Only Mup1 puncta were considered for quantification. Bar graphs represent averages from three independent experiments. Error bars represent standard deviation (SD). ns, > 0.05; ***, P < 0.001 (two-tailed Student’s t test). (I and J) Localization of Cps1 relative to LDs in wild-type, vps4Δ and vps4Δvps13Δ cells. Cells expressing mCherry-tagged Cps1 were grown in a synthetic medium, and LDs were stained with Bodipy 493/503 (green). Cells were analyzed by fluorescence microscopy, and individual slides are shown. Scale bar, 5 µm. (K) Percentage of Cps1 partially overlapping with Bodipy dots or Sec63. Cps1 dots (n ≥ 150) and Bodipy dots (n ≥ 800) were quantified by Image J as described in Fig. 1 C and Fig. 3 H. Bar graphs represent averages from three independent experiments. Error bars represent standard deviation (SD). **, P < 0.01; ***, P < 0.001 (two-tailed Student’s t test).
Figure 7.
Figure 7.
LDs and Any1 are critical to the formation of MVBs. (A and B) Analysis of endosomal structures in wild-type and mutant cells by TEM (see Materials and methods). Scale bars, 100 nm. (C and D) Quantification of the endosomal structures from A and B. (C)n = wt (118), LDΔ (115), any1Δ (114), and vps13Δ (97). (D)n = wt (22), LDΔ (40), vps13Δ (66). The diameter was always measured across the largest part of the MVBs. (E) Localization of Ypt7 relative to Vps4 in wild-type and any1Δ cells. Cells expressing GFP-tagged Ypt7 and mCherry-tagged Vps4 were grown in a synthetic medium and analyzed by fluorescence microscopy, and individual slices are shown. Scale bar, 5 µm. (F) Quantification of the number of Ypt7 and Vps4 from D. Ypt7 dots (n ≥ 100) and Vps4 dots (n ≥ 400) were quantified by Image J. The number of Ypt7 or Vps4 dots was manually counted from a summed projection. Error bars represent standard deviation (SD). Bar graphs represent averages from three independent experiments. ns, > 0.05; ***, P < 0.001 (two-tailed Student’s t test). (G) Working model of Any1 function in endosome biogenesis. For details see text.

References

    1. Abraham, M.J., Murtola T., Schulz R., Páll S., Smith J.C., Hess B., and Lindah E.. 2015. Gromacs: High performance molecular simulations through multi-level parallelism from laptops to supercomputers. SoftwareX. 1–2:19–25. 10.1016/j.softx.2015.06.001 - DOI
    1. Adell, M.A.Y., Migliano S.M., Upadhyayula S., Bykov Y.S., Sprenger S., Pakdel M., Vogel G.F., Jih G., Skillern W., Behrouzi R., et al. . 2017. Recruitment dynamics of ESCRT-III and Vps4 to endosomes and implications for reverse membrane budding. Elife. 6:e31652. 10.7554/eLife.31652 - DOI - PMC - PubMed
    1. Arlt, H., Auffarth K., Kurre R., Lisse D., Piehler J., and Ungermann C.. 2015. Spatiotemporal dynamics of membrane remodeling and fusion proteins during endocytic transport. Mol. Biol. Cell. 26:1357–1370. 10.1091/mbc.E14-08-1318 - DOI - PMC - PubMed
    1. Babst, M., Wendland B., Estepa E.J., and Emr S.D.. 1998. The Vps4p AAA ATPase regulates membrane association of a Vps protein complex required for normal endosome function. EMBO J. 17:2982–2993. 10.1093/emboj/17.11.2982 - DOI - PMC - PubMed
    1. Bean, B.D.M., Dziurdzik S.K., Kolehmainen K.L., Fowler C.M.S., Kwong W.K., Grad L.I., Davey M., Schluter C., and Conibear E.. 2018. Competitive organelle-specific adaptors recruit Vps13 to membrane contact sites. J. Cell Biol. 217:3593–3607. 10.1083/jcb.201804111 - DOI - PMC - PubMed

MeSH terms

Substances

LinkOut - more resources