. 2025 Mar 6;10(8):e185061.
doi: 10.1172/jci.insight.185061. eCollection 2025 Apr 22.

CD8+ TEMRAs in severe asthma associate with asthma symptom duration and escape proliferation arrest

Affiliations

CD8+ TEMRAs in severe asthma associate with asthma symptom duration and escape proliferation arrest

Richard P Ramonell et al. JCI Insight. .

Abstract

Aberrant immune response is a hallmark of asthma, with 5%-10% of patients suffering from severe disease exhibiting poor response to standard treatment. A better understanding of the immune responses contributing to disease heterogeneity is critical for improving asthma management. T cells are major players in the orchestration of asthma, in both mild and severe disease, but it is unclear whether specific T cell subsets influence asthma symptom duration. Here we show a significant association of airway CD8+ effector memory T cells re-expressing CD45RA (TEMRAs), but not CD8+CD45RO+ or tissue-resident memory T cells, with asthma duration in patients with severe asthma (SA) but not mild to moderate asthma (MMA). Higher frequencies of IFN-γ+CD8+ TEMRAs compared with IFN-γ+CD45RO+ T cells were detected in SA airways, and the TEMRAs from patients with SA but not MMA proliferated ex vivo, although both expressed cellular senescence-associated biomarkers. Prompted by the transcriptomic profile of SA CD8+ TEMRAs and proliferative response to IL-15, airway IL15 expression was higher in patients with SA compared with MMA. Additionally, IL15 expression in asthmatic airways negatively correlated with lung function. Our findings add what we believe is a new dimension to understanding asthma heterogeneity, identifying IL-15 as a potential target for treatment.

Keywords: Asthma; Cytokines; Immunology; Pulmonology; T cells.


Conflict of interest statement

Conflict of interest: SEW is PI on an investigator-initiated study funded by Regeneron.

Figures

Figure 1
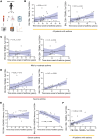
Figure 1. Association of T cell subsets with time since the onset of asthma symptoms.
(A) Overall experimental design. (B) Linear regression of PB CD8+ TEMRAs (percentage of CD8+ cells) as a function of the time in years since the onset of an individual’s asthma symptoms. (C) Linear regression of PB (left) and BAL (right) CD8+ TEMRAs (percentage of CD8+ cells) from patients with MMA as a function of the time in years since the onset of an individual’s asthma symptoms. (D) Linear regression of PB (left) and BAL (right) CD8+ TEMRAs (percentage of CD8+ cells) from patients with SA as a function of the time in years since the onset of a subject’s asthma symptoms. (E) Linear regression of PB (left) and BAL (right) CD8+CD45RO+ memory (percentage of CD8+ cells) from patients with SA as a function of the time in years since the onset of a subject’s asthma symptoms. (F) Linear regression of PB CD8+ TEMRAs (percentage of CD8+ cells) as a function of BAL CD8+ TEMRAs (percentage of CD8+ cells). Statistical significance in BF determined using Spearman’s nonparametric correlations, with solid black lines representing simple linear regression line and shaded blue area representing 95% confidence interval.
Figure 2
Figure 2. Compared with CD8+CD45RO+ memory T cells, CD8+ TEMRAs in PB display higher percentages of IFN-γ+ and senescence marker–expressing cells.
(A) Percentage of cytokine-expressing PB cells from patients with SA. (B) Percentages of BAL cells expressing cytokines from patients with SA. (C and D) Percentages of PB IFN-γ+ cells expressing senescence-associated surface proteins from patients with SA. Statistical significance for data in A, B, and D determined using Wilcoxon’s matched-pairs signed rank test and for data in C determined using Kruskal-Wallis followed by multiple pairwise comparisons. Data represent median ± 95% confidence interval.
Figure 3
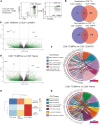
Figure 3. Transcriptional features of PB CD8+ TEMRAs in SA suggest inflammatory phenotype and a role for IL-15.
(A) Representative gating strategy for flow sorting 3 CD8+ T cell populations from patients with SA: naive, CD45RO+ memory, and TEMRAs. (B) Venn diagrams illustrating the number of genes differentially upregulated (left) or downregulated (right) versus CD8+ naive T cells. (C) Volcano plot illustrating DEGs in sorted CD8+ TEMRAs versus CD8+ CD45RO+ memory. (D) Volcano plot illustrating DEGs in sorted CD8+ TEMRAs versus CD8+ naive T cells. (E) Heatmap illustrating median enrichment scores for 3 GO terms using GSVA. (F) Chord plot representation showing core genes within enriched pathways corresponding to the GO terms shown for CD8+ TEMRA versus CD45RO+ memory comparisons revealed by GSEA. (G) Chord plot representation showing core genes within enriched pathways corresponding to the GO terms shown for CD8+ TEMRA versus CD8+ naive T cell comparisons revealed by GSEA.
Figure 4
Figure 4. IL15 expression in bronchial brushings implicates IL-15 in disease pathogenesis in SA.
(A) IL15 gene expression in cells isolated from endobronchial brushings. (B) Linear regression of percentage predicted forced expiratory volume in 1 second (FEV1) as a function IL15 gene expression. (C) Linear regression of CD3E gene expression (left) or CD8A gene expression (right) as a function IL15 gene expression. (D) Linear regression of IFNG gene expression (left) or TNF (right) as a function IL15 gene expression. Statistical significance for data shown in A determined using Mann-Whitney test and for panels BD using Spearman’s nonparametric correlations, with solid black lines representing simple linear regression line and shaded blue area representing 95% confidence interval.
Figure 5
Figure 5. IL-15Rα is detectable by immunofluorescence in the airways of patients with SA.
(A) Immunofluorescence microscopy of endobronchial biopsy specimens from patients with mild to moderate asthma (top) and severe asthma (bottom). Images are representative of n = 3 from each group. Tissues were stained for IL-15Rα (red), EpCAM (green), and were counterstained with Hoechst (blue) to highlight nuclei. Scale bars: 50 μm. Plots show (B) normalized area of EpCAM, (C) IL-15Rα, (D) IL-15Rα expression in EpCAM+ cells, and (E) the ratio of IL-15Rα to EpCAM expression. Quantification of immunofluorescence labeling corrected for background signal. Statistical significance for data in panels BE determined using Mann-Whitney test. Data in panels BE represent median ± 95% confidence interval.
Figure 6
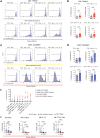
Figure 6. PB CD8+ TEMRAs retain proliferative capacity in SA, but not MMA, despite senescent phenotype of both.
(A) Histograms of CellTrace Blue dye in CD8+ TEMRAs isolated from patients with MMA (top) or SA (bottom). (B) Percentage of PB CD8+ TEMRAs proliferating as measured by CellTrace Blue dye under 4 stimulation conditions. (C) Histograms of CellTrace Blue dye in CD8+CD45RO+ memory T cells isolated from patients with MMA (top) or SA (bottom). (D) Percentage of PB CD8+CD45RO+ memory T cells proliferating as measured by CellTrace Blue dye under 4 stimulation conditions. (E) Dot plot showing T cell proliferation responses to different stimulation conditions in patients with MMA (blue points) or SA (red points). Each point represents the mean value (n = 6), with error bars representing the standard error of the mean. (F) Percentage of IL-15Rα–expressing PB cells from patients with SA at baseline, 48 hours in culture, 48 hours in culture with IL-15, or 48 hours in culture with TCRhi stimulation. Statistical significance for data shown in B and D determined using Mann-Whitney test and for data shown in F determined using Kruskal-Wallis followed by multiple pairwise comparisons. Data in B, D, and F represent median ± 95% confidence interval.

References

    1. Wenzel SE. Asthma phenotypes: the evolution from clinical to molecular approaches. Nat Med. 2012;18(5):716–725. doi: 10.1038/nm.2678. - DOI - PubMed
    1. Ray A, et al. Are We meeting the promise of endotypes and precision medicine in asthma? Physiol Rev. 2020;100(3):983–1017. doi: 10.1152/physrev.00023.2019. - DOI - PMC - PubMed
    1. Levy ML, et al. Key recommendations for primary care from the 2022 Global Initiative for Asthma (GINA) update. NPJ Prim Care Respir Med. 2023;33(1):7. doi: 10.1038/s41533-023-00330-1. - DOI - PMC - PubMed
    1. Sharma S, et al. Asthma pathogenesis: phenotypes, therapies and gaps. Summary of the Aspen Lung Conference 2023. Am J Respir Cell Mol Biol. 2024;71(2):154–168. - PMC - PubMed
    1. Hekking PW, et al. The prevalence of severe refractory asthma. J Allergy Clin Immunol. 2015;135(4):896–902. doi: 10.1016/j.jaci.2014.08.042. - DOI - PubMed