. 2025 Apr;12(16):e2410160.
doi: 10.1002/advs.202410160. Epub 2025 Mar 6.

Large-Scale Plasma Proteomics to Profile Pathways and Prognosis of Chronic Pain

Affiliations

Large-Scale Plasma Proteomics to Profile Pathways and Prognosis of Chronic Pain

Ze-Yu Li et al. Adv Sci (Weinh). 2025 Apr.

Abstract

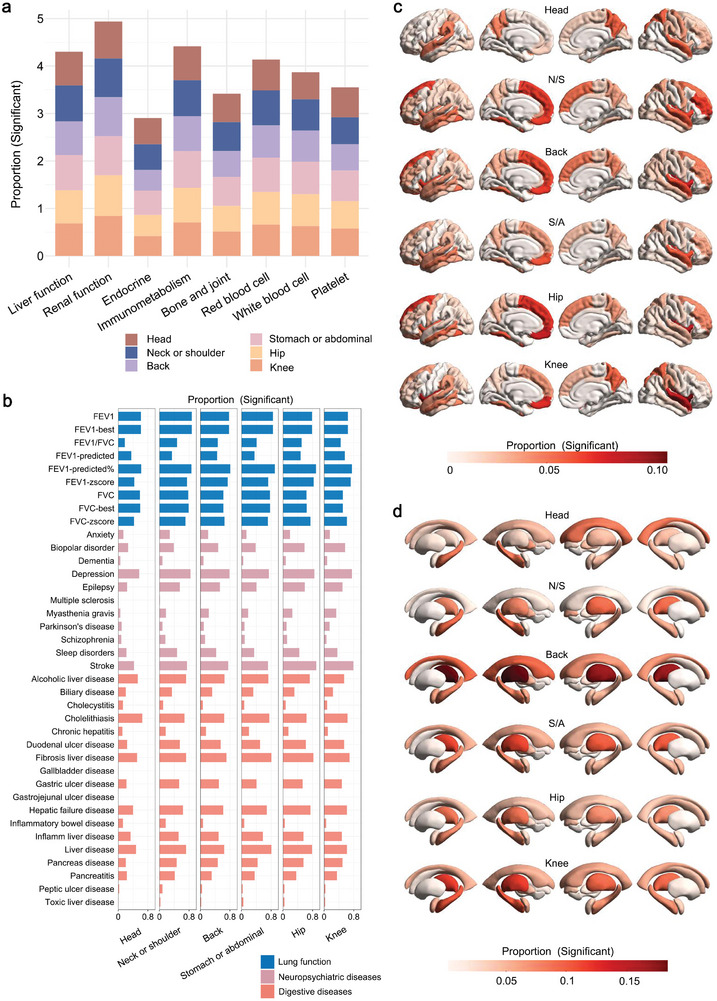
While increasing peripheral mechanisms related to chronic pain, the plasma proteomics profile associated with it and its prognosis remains elusive. This study utilizes 2923 plasma proteins and chronic pain of 51 644 participants from UK Biobank and finds 474 proteins linked to chronic pain in six sites: head, neck or shoulder, back, stomach or abdominal, hip, and knee, with 11 proteins sharing across pain sites. The identified proteins are largely enriched in immune and metabolic pathways and highly expressed in tissues like lungs and small intestines. Phenome-wide analysis highlights the significance of pain-related proteome on diverse facets of human health, and in-depth Mendelian randomization validates 10 proteins (CD302, RARRES2, TNFRSF1B, BTN2A1, TNFRSF9, COL18A1, TNF, CD74, TNFRSF4, and BTN2A1) as markers of chronic pain. Furthermore, protein sets capable of classifying pain patients and healthy participants, particularly performing best in hip pain (area under curve, AUC = 0.725), are identified. Interestingly, the prediction of pain spreading over ten years achieves an AUC of 0.715, with leptin identified as a crucial predictor. This study delineates proteins associated with various pain conditions and identifies proteins capable of classifying pain and predicting pain spreading, offering benefits for both research and clinical practice.

Keywords: Mendelian randomization; UK Biobank; chronic pain; plasma proteomic; prediction.


Conflict of interest statement

The authors declare no conflict of interest.

Figures

Figure 1
Figure 1
The overall study design. a) Data used in the study, including chronic pain, plasma proteins, genotype data, and pain‐related traits. i) Chronic pain was measured at baseline and online follow‐up, including six body sites: head, neck or shoulder, back, stomach or abdominal, hip, and knee. ii) Plasma proteins were divided into four categories: cardiometabolic, inflammation, neurology, and oncology. iii) Genotype data were used in the genome‐wide association analysis. iv) Pain‐related phenotypes included blood indicators (liver function, renal function, endocrine, immune, joint, and blood cell), lung function, neuropsychiatric diseases, digestive diseases, and brain volumes. b) Analysis process in the study. i) Association analysis between chronic pain and plasma proteins. ii) Biological function analysis of pain‐related proteins, including ontology pathway and tissue expression analyses. iii) Phenome‐wide association analysis of pain‐related proteins. iv) Mendelian randomization of chronic pain and proteins. v) Classification of chronic pain at baseline. vi) Prediction of pain spreading after a ten‐year follow‐up.
Figure 2
Figure 2
Relationship between chronic pain and plasma proteins. a) Scatter plots show the associations between 2923 proteins and chronic pain at six body sites. Logistic regression model was used to examine the association between protein levels and chronic pain. Analyses were adjusted for age, sex, BMI, race, Townsend deprivation index, highest educational qualification, assessment center, batch, and sample age. P‐values shown are two‐sided and not adjusted for multiple comparisons. The gray horizontal line indicates the significance threshold (P < 2.85 × 10⁻⁶), and the colored dots above the line indicate that the protein was significantly associated with the disease. The vertical line represents a dividing line with an odds ratio of 1, and the point to the right of the line indicates that the higher level of this protein increased the risk of disease. b) Plots show the proportion of each category of proteins significantly associated with pain, including four categories: cardiometabolic, inflammation, neurology, and oncology. c) Venn diagram shows the overlap of proteins significantly associated with pain at different body sites.
Figure 3
Figure 3
Biological function of pain‐related proteins. a) Plot shows the pathway enrichment of proteins related to stomach or abdominal pain. Analyses were conducted by R package clusterProfiler, and gene set databases included Gene Ontology and Kyoto Encyclopedia of Genes and Genomes. The GO terms were divided into three categories: Biological Process, Cellular Component, and Molecular Function. P‐values shown are two‐sided and not adjusted for multiple comparisons. b) Plot shows the pathway enrichment of proteins related to hip pain. c) Plot shows the pathway enrichment of all 474 pain‐related proteins. d) Plot shows the tissue‐specific type expression of pain‐related proteins. Analyses were performed by the GENE2FUNC implemented in Functional Mapping and Annotation (FUMA). The tissue analyses used the GTEx v8 database and contained 54 tissue types. P‐values shown are two‐sided and not adjusted for multiple comparisons.
Figure 4
Figure 4
Phenome‐wide association of pain‐related proteins. Phenome‐wide association used linear and logistic regression models to examine associations between protein levels and phenotypes. Analyses were adjusted for age, sex, BMI, race, Townsend deprivation index, highest educational qualification, assessment center, batch, sample age, and total intracranial volume (only used in the brain volume analysis). a) Proportion of pain‐related proteins significantly associated with each blood indicator category. b) Proportion of pain‐related proteins significantly associated with each phenotype in lung function, neuropsychiatric diseases, and digestive diseases. c,d) Proportion of pain‐related proteins significantly associated with each cortical and subcortical region volume. N/S, neck or shoulder; S/A, stomach or abdominal.
Figure 5
Figure 5
Mendelian randomization (MR) analysis between chronic pain and proteins. Plot shows the top five associated proteins for pain in each body site in the MR analysis using the inverse variance weighted (IVW) method. Two‐sample MR analysis was performed using R package TwoSampleMR, with the protein as the exposure and chronic pain as the outcome. P‐values shown are two‐sided and not adjusted for multiple comparisons. The red font indicates that the association remained significant after FDR correction (P FDR < 0.05).
Figure 6
Figure 6
Classification and prediction of chronic pain. a) Plot shows the sample sizes of chronic pain patients and healthy individuals at baseline. b) Plot shows changes in the number of pain sites between baseline and follow‐up. c) The importance of features in the headache classification model. Bar chart shows the ranking of the importance of the variables according to their contribution to the model classification. Line chart shows the cumulative AUC value of the model that adds a feature in order at each iteration. d) The importance of features in the hip pain model. e) The importance of features in the pain spreading model. f) The receiver operating characteristic (ROC) curve of the headache model. In the coordinate system, the vertical axis is the true positive rate, and the maximum value is 1. The horizontal axis is the false positive rate, and the maximum value is 1. g) ROC curve of the hip pain model. h, ROC curve of the pain spreading model using the one‐versus‐rest (OVR) macro‐average method.

References

    1. Cohen S. P., Vase L., Hooten W. M., Lancet 2021, 397, 2082. - PubMed
    1. Zimmer Z., Fraser K., Grol‐Prokopczyk H., Zajacova A., Pain 2022, 163, 1740 . - PMC - PubMed
    1. Dahlhamer J., Morb. Mortal. Wkly. Rep. 2018, 67 , 1001. - PMC - PubMed
    1. Tinnirello A., Mazzoleni S., Santi C., Biomolecules 2021, 11, 1256. - PMC - PubMed
    1. Zelaya C. E., Dahlhamer J. M., Lucas J. W., Connor E. M., NCHS Data Brief. 2020, 1. - PubMed

LinkOut - more resources