. 2025 Mar 6;13(3):e010871.
doi: 10.1136/jitc-2024-010871.

Immunosuppressive microenvironment of liver restrains chemotherapeutic efficacy in triple-negative breast cancer

Affiliations

Immunosuppressive microenvironment of liver restrains chemotherapeutic efficacy in triple-negative breast cancer

Mingduo Liu et al. J Immunother Cancer. .

Abstract

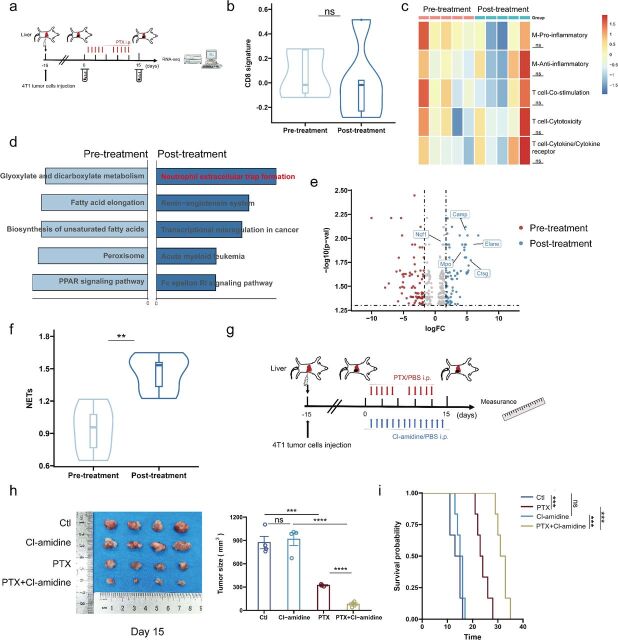
Background: Patients with liver metastases of triple-negative breast cancer (TNBC) show poor prognosis compared with other metastases. Chemotherapy is the primary treatment for advanced TNBC. Tumor cell diversity and the tumor microenvironment could affect therapeutic effect. However, whether liver metastases of TNBC exhibit differential chemotherapy efficacy compared with the primary tumors remains inadequately understood. The specific mechanisms that modulate chemotherapy efficacy in liver metastases need further investigation.

Methods: Single-cell RNA sequencing data from public databases were leveraged to contrast the immune profiles of liver metastases and primary tumors in TNBC. Murine models bearing liver tumors or primary tumors of TNBC were used to evaluate chemotherapy efficacy. Techniques such as immunohistochemistry, wound healing assays, and colony formation assays were employed to account for tumor heterogeneity. Intratumoral T lymphocytes and macrophages were quantified and characterized using RNA sequencing, immunohistochemistry, and flow cytometry. Antibody-mediated depletion of CD8+T cells or macrophages in mice substantiated their impact on chemotherapy responses.

Results: Single-cell RNA sequencing data showed the immune microenvironments of liver metastases and primary tumors exhibited significant differences, which may critically influence chemotherapy outcomes. Mouse models confirmed that chemotherapy was less effective against liver tumors compared with subcutaneous tumors. After excluding the influence of tumor cell heterogeneity, the weaker responsiveness in liver tumors was mediated by the impeded infiltration of CD8+T cells, attributed to the decreased activation of macrophages. Augmenting macrophage activation can improve the chemotherapeutic efficacy in liver tumors. Moreover, chemotherapy drove the immune microenvironment towards increased suppression through distinct mechanisms, with neutrophil extracellular traps (NETs) accumulating in liver tumors and impaired functionality of macrophages at the primary site. The combination of NET inhibitors or macrophage activators with chemotherapy enhanced treatment effectiveness.

Conclusions: These findings disclose the compromised chemotherapeutic efficacy in liver tumors of TNBC and elucidate the underlying immune-related mechanisms within the tumor microenvironment. Targeting the specific underpinnings of immune suppression at different tumor sites with selective drugs could optimize chemotherapeutic efficacy.

Keywords: Breast Cancer; Chemotherapy; Immunosuppression; Tumor infiltrating lymphocyte - TIL; Tumor microenvironment - TME.


Conflict of interest statement

Competing interests: No, there are no competing interests.

Figures

Figure 1
Figure 1
Different immune microenvironments in liver metastases from primary tumors in TNBC (a) Schematic overview of (b–f). Single cell sequencing data from 17 TNBC primary tumors and 4 liver metastases were collected and integrated for analysis. (b) T-distributed stochastic neighbor embedding (t-SNE) plots of immune cells colored by cell cluster. (c) Bar plots showing the distribution of immune cell proportions. (d) T-SNE plots of T cells colored by cell cluster. (e) Bar plots showing the distribution of T cell proportions. (f) Bar plots showing the mean scores of GO pathways enriched in upregulated genes in CD8+T cells. Significance determined by χ2 test or Fisher’s exact test (c, e). Significance was determined as p<0.05. ns, p≥0.05; ***p<0.001, ****p<0.0001. Parts of (a) were drawn using pictures from Servier Medical Art. Servier Medical Art by Servier is licensed under a Creative Commons Attribution 3.0 Unported License (https://creativecommons.org/licenses/by/3.0/). DC, dendritic cell; TNBC, triple-negative breast cancer.
Figure 2
Figure 2
Weaker chemotherapeutic efficacy in liver tumors compared with subcutaneous tumors in preclinical models (a) Schematic overview of (b–d). The mice bearing 4T1 liver tumors (Liver) induced by intrasplenic inoculation or subcutaneous tumors (SC) were treated with PTX from day 1 to day 14. The control group was given an equivalent volume of PBS. (b) Representative bioluminescent imaging of mice in (a) on day 15, with n=3 for visualization and quantification. (c) Survival curves of mice in (a), monitored until the time of death, with n=6. (d) Quantification of CD8+T cells in Liver and SC on day 0, with n=4. (e) Schematic overview of (f–i). The mice bearing 4T1 liver tumors (Liver) induced by subcapsular hepatic inoculation or SC were treated with PTX from day 1 to day 14. The control group was given an equivalent volume of PBS. (f) Tumor volume curves of mice in (e), with n=6. (g) Representative images of tumors harvested from mice in (e) on day 15, with n=6. (h) Survival curves of mice in (e), monitored until the time of death, with n=6. (i) Representative bioluminescent imaging of mice in (e) on day 15, with n=3 for visualization and quantification. The experiments were independently replicated on multiple occasions. Data are mean±SE (b, d, f, i). Significance determined by two-tailed unpaired t-test (b, d, f, i) and log-rank test (c, h). Significance was determined as p<0.05. ns, p≥0.05; *p<0.05, **p<0.01, ***p<0.001, ****p<0.0001. Parts of (a, e) were drawn using pictures from Servier Medical Art.
Figure 3
Figure 3
The differences in chemotherapeutic efficacy were mediated by CD8+T cells (a) Schematic overview of (b–e). 4T1 subcutaneous tumors (SC), liver tumors (Liver) induced by subcapsular hepatic inoculation, and peripheral blood from the mouse models were collected before paclitaxel treatment for further analysis, including RNA-seq, IHC, and flow cytometry analysis. (b) Bar plots showing the mean scores of GO pathways enriched in differentially expressed genes between Liver (n=5) and SC (n=3). (c) Representative IHC staining for CD8 and CD4 in Liver and SC, with quantitative analysis, n=3. The scale bar represents 30 µm. (d) Representative flow cytometry plots and quantification of CD8+T and CD4+T cells in Liver and SC, with n=6. (e) Representative flow cytometry plots and quantification of CD8+T and CD4+T cells in peripheral blood, with n=6. (f) Schematic overview of (g, h). Mice bearing SC and Liver were intraperitoneally injected with aCD8 or isotype control from day 0 to day 15, with paclitaxel administration from day 1 to day 14. (g) Representative images and quantification of tumor burden from mice in (f) on day 15, with n=4. (h) Survival curves of mice in (f), monitored until the time of death, with n=6. The experiments were independently replicated on multiple occasions. Data are mean±SE (c, d, e, g). Significance determined by two-tailed unpaired t-test (c, d, e, g) and log-rank test (h). Significance was determined as p<0.05. ns, p≥0.05; *p<0.05, **p<0.01, ***p<0.001, ****p<0.0001. Parts of (a, f) were drawn using pictures from Servier Medical Art. GO, Gene Ontology; IHC, immunohistochemistry.
Figure 4
Figure 4
Hypoactive macrophages impede CD8+T cell infiltration in liver metastases. (a) Heatmap of cell-to-cell communication among various cell subpopulations in TNBC liver metastases and primary tumors, derived from human scRNA-seq. (b) Bar plots showing the mean scores of GO pathways enriched in differentially expressed genes in macrophages, derived from human scRNA-seq. (c) Schematic overview of (d-, e). 4T1 liver tumors (Liver) induced by subcapsular hepatic inoculation and subcutaneous tumors (SC) from mouse models were collected before paclitaxel treatment for further analysis, including RNA-seq and flow cytometry analysis. (d) Box plots of gene set enrichment scores for antigen processing and presentation in SC (n=3) and Liver (n=5), calculated using ssGSEA. (e) Representative flow cytometry plots and quantification of MHC-II+ (n=3) and CD86+ (n=5) macrophages. (f) Schematic overview of (g-–j). Mice bearing LliverlLiver and SC were intraperitoneally injected with clodronate (Clo) or PBS liposomes from day −15 to day 15, with paclitaxel administration from day 1 to day 14. (g) Representative images and quantification of tumor burden from mice in (f) on day 15, with n=4. (h) Survival curves of mice in (f), monitored until the time of death, with n=6. (i) Representative IHC staining for CD8 on day 0, with quantitative analysis, n=3. ScaleThe scale bar represents 30 μm µm. (j) Representative flow cytometry plots and quantification of CD8+T cells on day 0, with n=5. (k) Schematic overview of (l). Mice bearing LiverlLiver were treated with glufosinate (Glu) or PBS via gavage from day −14 to day −1, with paclitaxel administration from day 1 to day 14. (l) Representative images and quantification of tumor burden from mice in (k) on day 15, with n=5. The experiments were independently replicated on multiple occasions. Data are mean±standard errorSE (d, e, g, i, j, l). Significance determined by two-tailed unpaired t-test (d, e, g, i, j, l) and log-rank test (h). Significance was determined as Pp<0.05. ns, pp≥0.05; *, pp<0.05; **, pp<0.01; ***, pp<0.001; ****, pp<0.0001*p<0.05, **p<0.01, ***p<0.001, ****p<0.0001. Parts of (c, f, k) were drawn using pictures from Servier Medical Art. GO, Gene Ontology; IHC, immunohistochemistry; ssGSEA, single-sample gene set enrichment analysis; TNBC, triple-negative breast cancer.
Figure 5
Figure 5
Chemotherapy induces an immunosuppressive tumor microenvironment in TNBC primary tumors (a) Schematic overview of (b, c). Single-cell sequencing data from primary tumor samples of five TNBC patients before and after paclitaxel treatment were collected and analyzed. (b) Violin plots of gene expression on immune-related genes of macrophages. (c) Violin plots of activation and inflammation scores of CD8+T cells, calculated using ssGSEA. (d) Schematic overview of (e–g). 4T1 subcutaneous tumors in mouse models were collected before and after paclitaxel treatment for further analysis, including RNA-seq and flow cytometry analysis. (e) Heatmap of gene set enrichment scores, with n=3, calculated using ssGSEA. (f) Representative flow cytometry plots and quantification of CD86+ and CD206+ macrophages, with n=6. (g) Representative flow cytometry plots and quantification of CD8+ and CD44+CD62L− CD8+T cells, with n=4. (h) Schematic overview of (i–l). Mice bearing subcutaneous tumors were treated with paclitaxel and glufosinate (Glu) from day 1 to day 14. The control group was given an equivalent volume of PBS. (i) Representative images and quantification of tumor burden from mice in (h) on day 15, with n=4. (j) Survival curves of mice in (h), monitored until the time of death, with n=6. (k) Representative flow cytometry plots and quantification of CD86+ and CD206+ macrophages, with n=4. (l) Representative flow cytometry plots and quantification of CD8+and CD44+CD62L- CD8+T cells, with n=4. The experiments were independently replicated on multiple occasions. Data are mean±SE (f, g, i, k, l). Significance determined by two-tailed unpaired t-test (e, f, g, i, k, l), Wilcoxon test (b, c), and log-rank test (j). Significance was determined as p<0.05. ns, p≥0.05; *p<0.05, **p<0.01, ***p<0.001, ****p<0.0001. Parts of (a, d, h) were drawn using pictures from Servier Medical Art. ssGSEA, single-sample gene set enrichment analysis; TNBC, triple-negative breast cancer.
Figure 6
Figure 6
Chemotherapy induces an immunosuppressive tumor microenvironment in TNBC liver tumors (a) Schematic overview of (b–f). 4T1 liver tumors induced by subcapsular hepatic inoculation in mouse models were collected before and after paclitaxel treatment for RNA-seq. (b) Violin plots of gene set enrichment scores for CD8 gene signature, with n=5, calculated using ssGSEA. (c) Heatmap of gene set enrichment scores, with n=5, calculated using ssGSEA. (d) Bar plots showing the mean scores of KEGG pathways enriched in differentially expressed genes, with n=5. (e) Volcano plots of differentially expressed genes, with n=5. (f) Violin plots of gene set enrichment scores for NETs, with n=5, calculated using ssGSEA. (g) Schematic overview of (h, i). Mice bearing 4T1 liver tumors induced by subcapsular hepatic inoculation were intraperitoneally injected with paclitaxel and Cl-amidine from day 1 to day 14. The control group was given an equivalent volume of PBS. (h) Representative images and quantification of tumor burden from mice in (g) on day 15, with n=4. (i) Survival curves of mice in (g), monitored until the time of death, with n=6. The experiments were independently replicated on multiple occasions. Data are mean±SE. (h) Significance determined by two-tailed unpaired t-test (b, c, f, h) and log-rank test (i). Significance was determined as p<0.05. ns, p≥0.05; **p<0.01, ***p<0.001, ****p<0.0001. Parts of (a, g) were drawn using pictures from Servier Medical Art. ssGSEA, single-sample gene set enrichment analysis; TNBC, triple-negative breast cancer.

References

    1. Siegel RL, Miller KD, Wagle NS, et al. Cancer statistics, 2023. CA Cancer J Clin 2023;73:17–48. 10.3322/caac.21763 - DOI - PubMed
    1. Loibl S, Poortmans P, Morrow M, et al. Breast cancer. Lancet 2021;397:1750–69. 10.1016/S0140-6736(20)32381-3 - DOI - PubMed
    1. Bianchini G, De Angelis C, Licata L, et al. Treatment landscape of triple-negative breast cancer - expanded options, evolving needs. Nat Rev Clin Oncol 2022;19:91–113. 10.1038/s41571-021-00565-2 - DOI - PubMed
    1. Nolan E, Lindeman GJ, Visvader JE. Deciphering breast cancer: from biology to the clinic. Cell 2023;186:1708–28. 10.1016/j.cell.2023.01.040 - DOI - PubMed
    1. Yin L, Duan J-J, Bian X-W, et al. Triple-negative breast cancer molecular subtyping and treatment progress. Breast Cancer Res 2020;22:61. 10.1186/s13058-020-01296-5 - DOI - PMC - PubMed

MeSH terms