. 2025 Dec;17(1):2473506.
doi: 10.1080/19490976.2025.2473506. Epub 2025 Mar 6.

Machine-learning assisted discovery unveils novel interplay between gut microbiota and host metabolic disturbance in diabetic kidney disease

Affiliations

Machine-learning assisted discovery unveils novel interplay between gut microbiota and host metabolic disturbance in diabetic kidney disease

I-Wen Wu et al. Gut Microbes. 2025 Dec.

Abstract

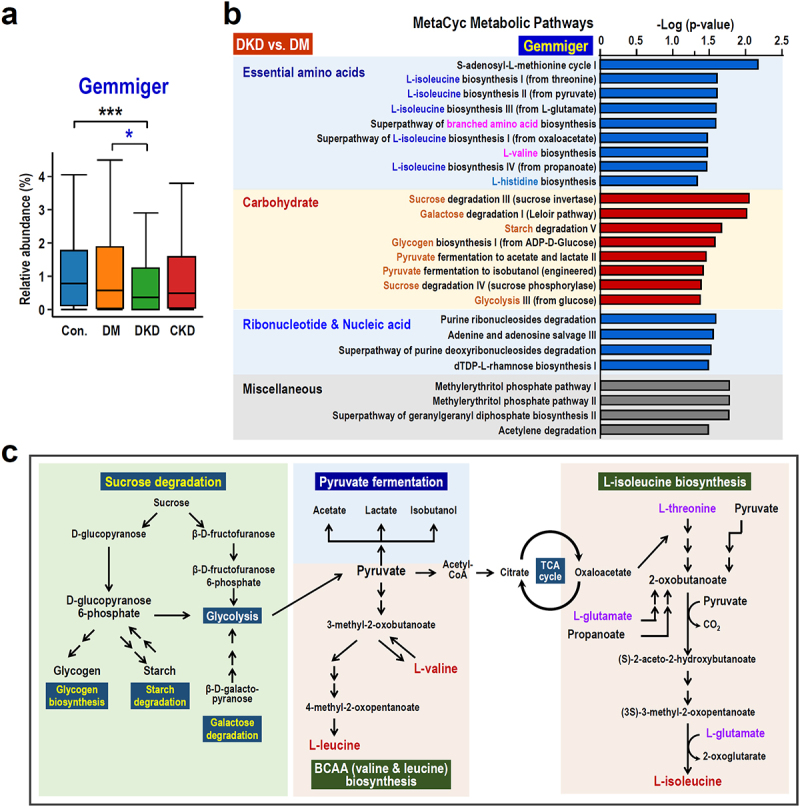
Diabetic kidney disease (DKD) is a serious healthcare dilemma. Nonetheless, the interplay between the functional capacity of gut microbiota and their host remains elusive for DKD. This study aims to elucidate the functional capability of gut microbiota to affect kidney function of DKD patients. A total of 990 subjects were enrolled consisting of a control group (n = 455), a type 2 diabetes mellitus group (DM, n = 204), a DKD group (n = 182) and a chronic kidney disease group (CKD, n = 149). Full-length sequencing of 16S rRNA genes from stool DNA was conducted. Three findings are pinpointed. Firstly, new types of microbiota biomarkers have been created using a machine-learning (ML) method, namely relative abundance of a microbe, presence or absence of a microbe, and the hierarchy ratio between two different taxonomies. Four different panels of features were selected to be analyzed: (i) DM vs. Control, (ii) DKD vs. DM, (iii) DKD vs. CKD, and (iv) CKD vs. Control. These had accuracy rates between 0.72 and 0.78 and areas under curve between 0.79 and 0.86. Secondly, 13 gut microbiota biomarkers, which are strongly correlated with anthropometric, metabolic and/or renal indexes, concomitantly identified by the ML algorithm and the differential abundance method were highly discriminatory. Finally, the predicted functional capability of a DKD-specific biomarker, Gemmiger spp. is enriched in carbohydrate metabolism and branched-chain amino acid (BCAA) biosynthesis. Coincidentally, the circulating levels of various BCAAs (L-valine, L-leucine and L-isoleucine) and their precursor, L-glutamate, are significantly increased in DM and DKD patients, which suggests that, when hyperglycemia is present, there has been alterations in various interconnected pathways associated with glycolysis, pyruvate fermentation and BCAA biosynthesis. Our findings demonstrate that there is a link involving the gut-kidney axis in DKD patients. Furthermore, our findings highlight specific gut bacteria that can acts as useful biomarkers; these could have mechanistic and diagnostic implications.

Keywords: Diabetic kidney disease; branched-chain amino acids; machine learning; microbiota.


Conflict of interest statement

No potential conflict of interest was reported by the author(s).

Figures

Figure 1.
Figure 1.
Determination of the bacterial biomarkers enriched in the DKD, DM, CKD and Control groups at genus-level (a) and species-level (b). The results were obtained using the linear discriminant analysis of effect size (LEfSe) method. In the comparison of DKD vs. DM, the genus Gemmiger (marked with blue) was concomitantly selected by both the LEfSe and ML methods. In the comparison of DKD vs. CKD, two genera, namely Veillonella and Acidaminococcus (marked with blue), were selected by both the LEfSe method and the ML methods.
Figure 2.
Figure 2.
Feature selection and model prediction of ML methods in order to differentiate DKD, DM and CKD patients. (a) Workflow of the ML algorithm including feature selection and model building. (b) The number of features selected was determined by AUC and accuracy for the various disease group comparisons. (c) The four panels of top features selected by ML. A venn diagram is used to present the number of unique and overlapped features among the four panels of top features. The list and rank of features for distinguishing (i) DM vs. Control; (ii) DKD vs. DM; (iii) DKD vs. CKD; (iv) CKD vs. Control. The unique features are highlighted with a background color. Feature types include clinical variables (age, BMI and gender), and features of the microbiota, namely RA (relative abundance), PA (presence or absence, and ratio (hierarchy ratio). Those microbes concomitantly selected by the ML method and at least one of the differential abundance methods (DESeq2, LEfSe, limma voom or MaAsLin2) are marked with pink. (d) Prediction performance of the gut microbiota present in different disease groups using ML algorithms with bootstrapping 100 times. Feature type: # indicates age, BMI and gender. Data are presented as means (standard deviation).
Figure 3.
Figure 3.
Correlation between bacterial biomarkers and clinical indexes using Spearman analysis. Thirteen gut bacterial biomarkers were concomitantly identified by the differential abundance method and ML algorithm across diverse group comparisons. The combinations of group comparisons are highlighted using a background color. *p value < 0.05, **p value < 0.01, ***p value < 0.001.
Figure 4.
Figure 4.
Pathway enrichment analysis and functional analysis of Gemmiger. (a) The relative abundance of Gemmiger in the control, DM, DKD and CKD groups. (b) MetaCycCyc metabolic pathway enrichment analysis of Gemmiger-associated pathways. (c) A graphic summary of the Gemmiger-related metabolic pathways. The interconnected metabolic pathways include the metabolism of several types of carbohydrates, pyruvate fermentation and BACC biosynthesis. The pathway annotation was carried out using MetaCyc metabolic pathway database (https://metacyc.Org). Abbreviations: TCA, tricarboxylic acid cycle. The box plots display median abundances and the interquartile range (IQR) multiplied by 1.5. Significance between groups was assessed using the Wilcoxon rank-sum test. The asterisks denote significance levels: *, p < 0.05; **, p < 0.01; ***, p < 0.001.

References

    1. U.S. Renal Data System . USRDS annual data report: epidemiology of kidney disease in the United States. Bethesda (MD): National Institutes of Health, National Institute of Diabetes and Digestive and Kidney Diseases; 2022.
    1. DeFronzo RA, Reeves WB, Awad AS.. Pathophysiology of diabetic kidney disease: impact of SGLT2 inhibitors. Nat Rev Nephrol. 2021;17(5):319–16. doi:10.1038/s41581-021-00393-8. - DOI - PubMed
    1. Fiaccadori E, Cosola C, Sabatino A. Targeting the gut for early diagnosis, prevention, and cure of diabetic kidney disease: Is the phenyl sulfate story another step forward? Am J Kidney Dis. 2020;75(1):144–147. doi:10.1053/j.ajkd.2019.07.001. - DOI - PubMed
    1. Cani PD. Microbiota and metabolites in metabolic diseases. Nat Rev Endocrinol. 2019;15(2):69–70. doi:10.1038/s41574-018-0143-9. - DOI - PubMed
    1. Kikuchi K, Saigusa D, Kanemitsu Y, Matsumoto Y, Thanai P, Suzuki N, Mise K, Yamaguchi H, Nakamura T, Asaji K, et al. Gut microbiome-derived phenyl sulfate contributes to albuminuria in diabetic kidney disease. Nat Commun. 2019;10(1):1835. doi:10.1038/s41467-019-09735-4. - DOI - PMC - PubMed

MeSH terms

LinkOut - more resources