. 2025 Mar 7;10(1):81.
doi: 10.1038/s41392-025-02162-6.

Host FSTL1 defines the impact of stem cell therapy on liver fibrosis by potentiating the early recruitment of inflammatory macrophages

Affiliations

Host FSTL1 defines the impact of stem cell therapy on liver fibrosis by potentiating the early recruitment of inflammatory macrophages

Xiaohong Zheng et al. Signal Transduct Target Ther. .

Abstract

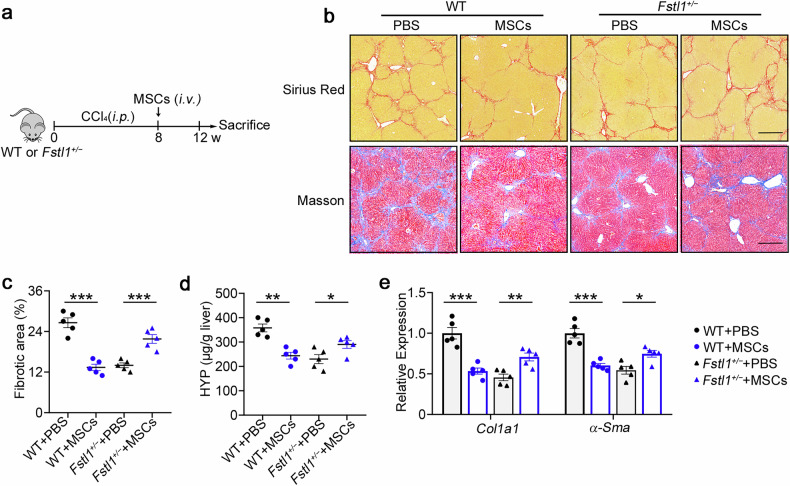
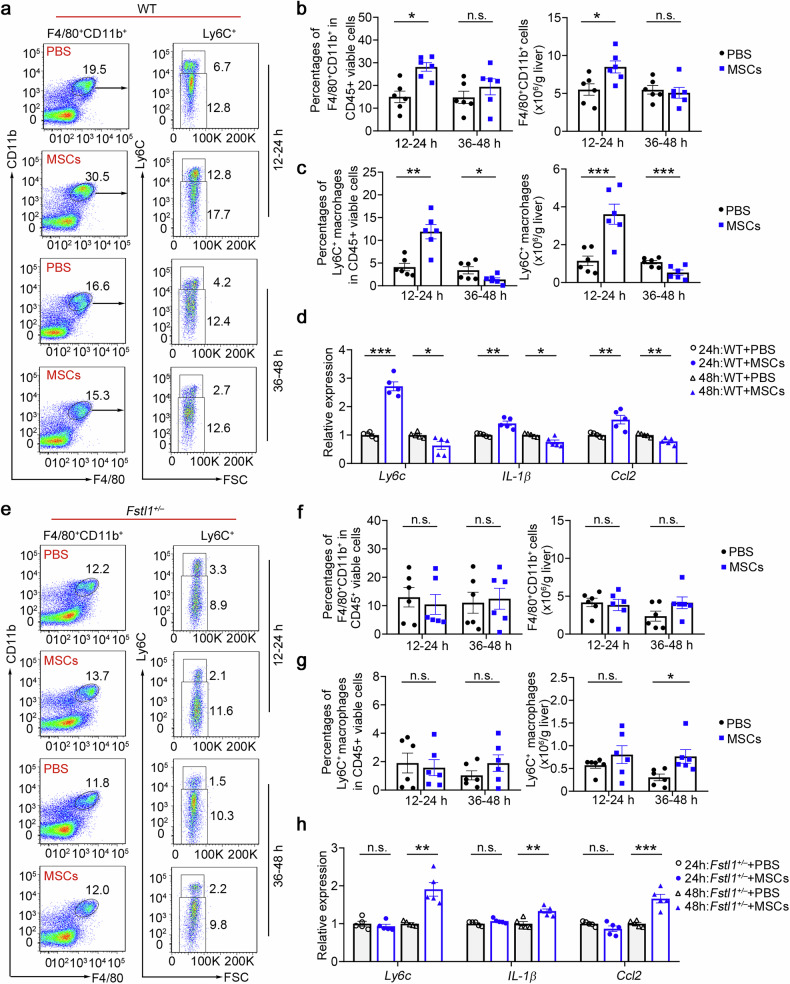
Adult stem cell therapy holds great promise for treating decompensated liver cirrhosis on the basis of animal studies, despite uncertainty about its clinical therapeutic efficacy and unclear underlying mechanisms. Here, we investigated the role of follistatin-like 1 (FSTL1), a profibrotic and proinflammatory matricellular protein, in inflammation-related heterogeneity in stem cell therapy. Our results showed that a high level of circulating FSTL1 is significantly correlated with therapeutic response in patients with cirrhosis. FSTL1 facilitated MSC-mediated early recruitment of Ly6C+ inflammatory macrophages within 24 h postinfusion, which was essential for the empowerment of MSCs and subsequent Ly6C-CX3CR1+ macrophage remodelling at 48 h postinfusion. Fstl1 deficiency abrogated early macrophage recruitment and effective Ly6C-CX3CR1+ macrophage accumulation, resulting in the poor antifibrotic effect of MSCs in mice. Whereas, recombinant FSTL1 protein restored the therapeutic efficacy of MSCs in CCl4-injured Fstl1+/- mice. Mechanistically, host FSTL1 enhanced rapid recycling of CCR2 to the membrane via activation of the CD14/TLR4/NF-κB/ATP6V1G2 axis, leading to early recruitment of Ly6C+ monocytes /macrophages. Taken together, our findings revealed that FSTL1 is a critical regulator of the fibrotic immune microenvironment and facilitates subsequent stem cell therapy. These data suggest that FSTL1 could serve as a predictive biomarker of stem cell therapy response in patients with liver cirrhosis.


Conflict of interest statement

Competing interests: The authors declare no competing interest.

Figures

Fig. 1
Fig. 1
Correlation analysis of serum FSTL1 with inflammatory cytokines and the response to autologous stem cell therapy in patients with liver cirrhosis. Correlation analysis of FSTL1 and fibrotic cytokines, including (a) TGF-β, (b) TNF-α, and (c) IL-6 (n = 58). d MELD change ratio according to the FSTL1 concentration (n = 58). e Serum FSTL1 in the MSC-responsive (n = 27) and MSC-nonresponsive groups (n = 31) determined by a magnetic Luminex assay (n = 58). f ROC curves with data comparing responsive (n = 27) and nonresponsive patients (n = 31). g Response ratios of the FSTL1high (≥4.7 ng/mL) and FSTL1low (<4.7 ng/mL) groups. h Ratios of FSTL1high and FSTL1low patients among responders (i) and nonresponders (j). Serum FSTL1 levels were evaluated in responders (n = 9) and nonresponders (n = 9) at 6 months after cell transplantation. Statistical significance was determined by the Spearman rank correlation test (ad), Mann–Whitney U test (e), and Wilcoxon’s matched-pairs test (i, j). Error bars indicate the mean ± SEM. Res, response; non-Res, nonresponse
Fig. 2
Fig. 2
Antifibrotic effects of stem cells are abrogated in Fstl1+/ mice. a Schematic illustration of hepatic fibrosis model establishment and the MSC-based treatment strategy. be The fibrosis degree was evaluated in Fstl1+/ (n = 5) and WT littermates (n = 5) at 4 weeks after cell infusion. b Liver sections were stained with Sirius red or Masson’s trichrome. Representative images of the staining are shown. Bars, 200 µm. c Liver fibrosis score analysis of Sirius red-stained liver sections. The fibrotic area is presented as a percentage. d The concentrations of hydroxyproline (HYP) in liver homogenates were determined. *p < 0.05, **p < 0.01, and ***p < 0.001. Statistical significance was determined by one-way ANOVA with Tukey multiple comparison test (c, d) or two-way ANOVA with Tukey multiple comparison test (e). Data are presented as the mean ± SEM and were pooled from at least three independent experiments
Fig. 3
Fig. 3
FSTL1 facilitates stem cell-mediated Ly6CCX3CR1+ subset remodelling. a UMAP analysis of 4300 macrophages from 3 PBS- and 3 MSC-treated mice identified 15 distinct cell clusters. b Cluster distribution of cells in PBS- (gray) and MSC- (purple) treated mice. c Comparison of the populations of different cell lineages between PBS-treated and MSC-treated livers. d The relative percentages of different cell lineages in each group, coloured according to cell lineage. PBS: n = 3 liver samples from PBS-treated mice; MSC: n = 3 liver samples from MSC-treated mice. e Heatmap displaying the relative expression levels of marker genes in 15 cell lineages (top, colour-coded by cell lineage), with exemplar genes labelled in Cluster 5. The columns denote cells; the rows denote genes. f Marker expression in different clusters. gj The percentages of the Ly6CCX3CR1+ subset among the total viable hepatic CD45+ cells and the cell count of the Ly6CCX3CR1+ subset were normalized to the liver weight, as determined by flow cytometry. g, h The Ly6CCX3CR1+ subset was evaluated in Fstl1+/ (n = 6) and WT littermates (n = 6) at 24 h (g) and 48 h (h) after MSC infusion. i The Ly6CCX3CR1+ subset was evaluated in C57BL/6 mice treated with (n = 5) or without the FSTL1 neutralizing antibody 22B6 (n = 5) at 48 h after MSC infusion. j The Ly6CCX3CR1+ subset was evaluated in Fstl1+/ (n = 5) and WT littermates (n = 5) at 48 h after MNC infusion. *p < 0.05, **p < 0.01, ***p < 0.001, and n.s., not significant. Statistical significance was determined by a two-tailed unpaired t-test (gj). Data are presented as the mean ± SEM and were pooled from at least three independent experiments
Fig. 4
Fig. 4
Early rapid recruitment of Ly6C+ macrophages after cell infusion is observed in the wild type. a Macrophage infiltration was evaluated in the wild type (n = 6) at 24 h and 48 h after MSC infusion via flow cytometry. b The percentages of F4/80+CD11b+ cells among the total viable CD45+ cells and the cell count normalized to the liver weight were determined. c The percentages of Ly6C+ macrophages in the F4/80 CD11b+ population were compared, and the cell count was normalized to the liver weight. d Macrophages were isolated from the livers of WT mice treated with (n = 6) or without (n = 6) MSCs at 48 h postinfusion. mRNA levels were determined by qPCR. e Macrophage infiltration was evaluated in Fstl1+/ cells (n = 6) at 24 h and 48 h after MSC infusion by flow cytometry. f The percentages of F4/80+CD11b+ cells among the total viable CD45+ cells and the cell count normalized to the liver weight were determined. g The percentages of Ly6C+ macrophages in the F4/80+CD11b+ population were compared, and the cell count was normalized to the liver weight. h Macrophages were isolated from the livers of Fstl1+/ mice treated with (n = 5) or without (n = 5) MSCs at 48 h postinfusion. mRNA levels were determined by qPCR. *p < 0.05, **p < 0.01, ***p < 0.001, and n.s., not significant. Statistical significance was determined by a two-tailed unpaired t-test (b, c, f, g) and two-way ANOVA with Tukey multiple comparison test (d, h). Data are presented as the mean ± SEM and were pooled from at least three independent experiments
Fig. 5
Fig. 5
Inflammatory macrophages reprogram metabolism and improve the immunosuppressive capacity of MSCs. a Schematic illustration of the hepatic fibrosis model establishment and the MSC-based treatment strategy. bd The degree of fibrosis was evaluated in the PBS-, MSC-, CsA+MSC-, and PF4136409 + MSC-treated groups at 4 weeks postinfusion (n = 5). b Liver sections were stained with Sirius red or Masson’s trichrome. Representative images of the staining are shown. Bars, 200 µm. c Liver fibrosis score analysis of Sirius red-stained liver sections. The fibrotic area is presented as a percentage. d The concentrations of hydroxyproline (HYP) in liver homogenates were determined. e Schematic of the in vitro coculture system for MSCs and BMDMs. f Volcano plot showing genes whose expression changed in MSCs cocultured with BMDMs compared with control MSCs, as determined by RNA-seq (n = 4). gj GSEA plots (left) and heatmaps (right) of the RNA-seq data of MSCs cocultured with BMDMs and control MSCs. Representative genes from each category are shown. FDR, false discovery rate; NES, normalized enrichment score. n = 4 mice per group. Statistical significance was determined by linear modelling and Bayesian statistics after correcting for multiple testing with the Benjamini–Hochberg procedure (f) or the Wald test with Benjamini–Hochberg’s multiple-comparison correction (gj). k Gene expression was determined by qPCR in MSCs cocultured with increasing amounts of BMDMs (n = 4). l Schematic of the in vitro coculture system for MSCs and BMDMs. m Gene expression was determined by qPCR in altered amounts of BMDMs cocultured with MSCs (n = 4). n, o The percentages of the Ly6CCX3CR1+ subset were determined via flow cytometry in altered amounts of BMDMs after coculture with MSCs (n = 6). *p < 0.05, **p < 0.01, ***p < 0.001, and n.s., not significant. Statistical significance was determined by one-way ANOVA with Tukey multiple comparison test (k, m, o). Data are presented as the mean ± SEM and were pooled from at least three independent experiments
Fig. 6
Fig. 6
FSTL1 potentiates Ly6C+ macrophage hepatic recruitment. a, b Macrophage infiltration was evaluated by flow cytometry in C57BL/6 mice (n = 5) after 8 weeks of CCl4 induction with or without 22B6 treatment (a). b The percentages of F4/80+CD11b+ cells among the total viable CD45+ cells and the cell counts normalized to the liver weight were determined. The percentages of Ly6C+ macrophages among the total viable CD45+ cells and the cell counts were normalized to the liver weight. c Schematic illustration of the adoptive transfer of CD45.1 bone marrow cells into CD45.2 Fstl1+/ mice. df CD45.1+ infiltrated macrophages (d, e) and CD45.1+Ly6C+ macrophages (f) were evaluated 48 h post injection (n = 5). g Transwell assays were used to evaluate monocyte-mediated CCL2-induced chemotaxis in cells treated with or without FSTL1 (n = 3). h Transwell assays were used to evaluate CCL2-induced chemotaxis in THP-1 cells with or without FSTL1 treatment (n = 5). Bars, 200 µm (g, h). i CCR2 expression in THP-1 cells was evaluated via FCM with the indicated concentrations of FSTL1. j, k CCR2 expression in monocytes was evaluated via FCM after FSTL1 treatment (n = 8). l CHX (10 μg/ml) was used to inhibit protein synthesis. CCR2 expression was evaluated at the indicated time points in the presence or absence of FSTL1. *p < 0.05, **p < 0.01, ***p < 0.001. Statistical significance was determined by a two-tailed unpaired t-test (b, e, fh, j, k). Data are presented as the mean ± SEM and were pooled from at least three independent experiments
Fig. 7
Fig. 7
FSTL1 increases CCR2 recycling to the membrane by downregulating ATP6V1G2 expression in a CD14/TLR/NF-κB-dependent manner. a THP-1 cells were subjected to cell fractionation analysis at 48 h after FSTL1 treatment (100 ng/ml). Western blot analysis of CCR2 and endosome markers (Rab4, Rab5, Rab11, EEA1, and Lamp1). bd HEK293 cells were transfected with the BRET donor CCR2-Nanoluc along with the BRET acceptor per well (HaloTag-Rab4, HaloTag-Rab11 or HaloTag-Rab7). The cells were treated with or without FSTL1 (100 ng/ml) for 20 h. CCL2 (100 ng/ml) was added and kinetic measurements of donor emission (460 nm) and acceptor emission (618 nm) were collected every 5 min for 60 min. e, f RNAseq analysis of THP-1 cells treated with or without FSTL1 for 12 h. Gene differential analysis is shown as a volcano plot (e) or heatmap (f). ATP6V1G2 expression was evaluated via qPCR (g, n = 3) or western blotting (h). i FCM analysis of CCR2 expression after 48 h of different treatments. j Cell fractionation analysis of CCR2 via western blotting in THP-1cells. k NanoBRET assays were used to evaluate the distribution of CCR2 in the recycling or degradation pathway in HEK293 cells treated with or without FSTL1 (100 ng/ml). l CCR2 expression was evaluated via western blotting after NF-κB inhibitor (bortezomib) treatment. EE, early endosome; RE, recycling endosome; LE, late endosome. **p < 0.01. Statistical significance was determined by a two-tailed unpaired t-test (g). Data are presented as the mean ± SEM and were pooled from at least three independent experiments
Fig. 8
Fig. 8
Administration of FSTL1 rescues the defective therapeutic effect of MSCs in Fstl1+/ mice. a Schematic illustration of hepatic fibrosis model establishment and the MSC-based early treatment strategy. b The fibrosis degree was evaluated in Fstl1+/ mice treated with FSTL1 (n = 5) or FSTL1 + PF4136409 (n = 5) at 4 weeks postinfusion. Liver sections were stained with Sirius red or Masson’s trichrome. Representative images of the staining are shown. Bars, 200 µm. c Liver fibrosis score analysis of Sirius red-stained liver sections. The fibrotic area is presented as a percentage. d The concentrations of hydroxyproline (HYP) in liver homogenates were determined. e Total liver RNA was extracted and the expression of Col1 and α-Sma was determined by qPCR. fh Macrophage infiltration was evaluated in Fstl1+/− mice treated with FSTL1 (n = 5) or FSTL1 + PF4136409 (n = 5) at 48 h post infusion. f The percentages of F4/80+CD11b+ cells among the total number of viable CD45+ cells and the number of CD11b+F4/80+ cells normalized to the liver weight were determined by flow cytometry. (g) The percentages of Ly6CCX3CR1+ cells among the total number of viable CD45+ cells and the cell counts of the Ly6CCX3CR1+ subset were compared. (h) F4/80+ macrophages were sorted from the livers of Fstl1+/ mice treated with FSTL1 or FSTL1 + PF4136409 at 24 h post infusion, and the mRNA levels of inflammatory markers (Arg-1, iNOS) and Mmp9 were determined by qPCR. *p < 0.05, **p < 0.01, and n.s. not significant. Statistical significance was determined by one-way ANOVA with Tukey multiple comparison test (c, d, f, g) or two-way ANOVA with Tukey multiple comparison test (e, h). Data are presented as the mean ± SEM and were pooled from at least three independent experiments

References

    1. Ramachandran, P. & Henderson, N. C. Antifibrotics in chronic liver disease: tractable targets and translational challenges. Lancet Gastroenterol. Hepatol.1, 328–340 (2016). - PubMed
    1. Coilly, A., Roche, B., Duclos-Vallée, J.-C. & Samuel, D. Optimum timing of treatment for hepatitis C infection relative to liver transplantation. Lancet Gastroenterol. Hepatol.1, 165–172 (2016). - PubMed
    1. Sarin, S. K. et al. Liver diseases in the Asia-Pacific region: a Lancet Gastroenterology & Hepatology Commission. Lancet Gastroenterol. Hepatol.5, 167–228 (2020). - PMC - PubMed
    1. Hoang, D. M. et al. Stem cell-based therapy for human diseases. Signal Transduct. Target Ther.7, 272 (2022). - PMC - PubMed
    1. Lee, C. W., Chen, Y. F., Wu, H. H. & Lee, O. K. Historical perspectives and advances in mesenchymal stem cell research for the treatment of liver diseases. Gastroenterology154, 46–56 (2018). - PubMed

MeSH terms