. 2025 Mar 6;15(1):7858.
doi: 10.1038/s41598-025-92254-8.

Cracking the code of a correlate of protection against SARS-CoV-2 breakthrough infection in cancer patients

Affiliations

Cracking the code of a correlate of protection against SARS-CoV-2 breakthrough infection in cancer patients

Yana Debie et al. Sci Rep. .

Abstract

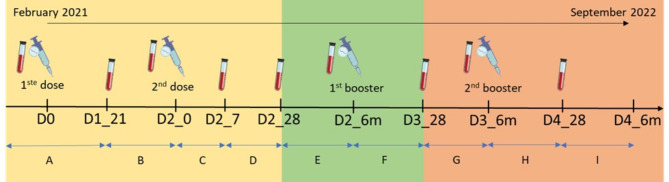
The level of protection against SARS-CoV-2 breakthrough infections conferred by the presence of anti-S1 SARS-CoV-2 antibodies (IgGs) in cancer patients is still understudied. This work examines the existence of an anti-S1 immunoglobulin G (IgG) -based correlate of protection (CoP) established by prospectively collected observational data about breakthrough infections with different SARS-CoV-2 variants in a large cohort study with vaccinated cancer patients. 760 cancer patients were longitudinally followed-up, starting before first vaccination until six months after second booster. Anti-S1 SARS-CoV-2 IgGs were quantified in serum samples (N = 2958) and breakthrough infections were monitored using questionnaires, routine COVID-19 testing and medical chart review. A Generalized Estimating Equations approach was used to model the binary infection status as endpoint in relation to anti-S1 IgG titers. It is observed that higher anti-S1 IgG titers correspond to a lower probability of breakthrough infection. For the early pandemic phase, a protective anti-S1 IgG titer above 20.42 BAU/mL was observed. However, with the emergence of the Omicron variant, higher anti-S1 IgG titers are required to be protective, but no clear CoP could be identified.

Keywords: Antibodies; Breakthrough infection; COVID-19; COVID-19 vaccination; Cancer patients; Correlate of protection; SARS-CoV-2.


Conflict of interest statement

Declarations. Competing interests: TV reports consultancy, advisory roles and honoraria from AstraZeneca outside the scope of presented work. The other authors report no conflicts of interest. Institutional review board statement: The study was conducted according to the guidelines of the Declaration of Helsinki, and approved by the Ethics Committee Antwerp University Hospital (EC nos. 2021–0543 dd. 01/02/2021, 2021-0541 dd. 09/08/2021, 21/12/172 dd. 17/05/2021). Informed consent: Informed consent was obtained from all subjects involved in the studies.

Figures

Fig. 1
Fig. 1
Patient vaccination flow diagram.
Fig. 2
Fig. 2
Classification of the used time periods with regards to vaccine administration and blood sampling. Classification of the different time periods used for statistical analysis. The yellow color defines the period at which few infections are observed, and no threshold estimation could be performed. The green color represents the period before Omicron was dominant in the population and the orange color represents the period at which Omicron was the dominant SARS-CoV-2 variant.
Fig. 3
Fig. 3
SARS-CoV-2 anti-S1 IgG antibody titers over the vaccination course. Data is presented as boxplots over time. Inside each boxplot, median values are depicted as a black line and outliers are depicted as black dots outside the boxes. The x-axis shows the time point of sample collection, expressed in terms of days or months since the indicated vaccine dose (e.g. D1_21 refers to 21 days after first vaccine dose, D3_6m refers to 6 months after third vaccine dose). The y-axis represents log-scaled SARS-CoV-2 anti-S1 IgG antibody titers (BAU/mL). Anti-S1 IgG antibody titers were quantified using a SARS-CoV-2 Immunoassay, Siemens Healthineers Atellica IM SARS-CoV-2 S IgG (sCOVG) assay, for the detection of antibodies (BAU/mL). The number of observations per time point (n), geometric mean titer (GMT) and percentage of responders (with IgG titers larger than LLD) are displayed below the figure. * indicates p < 0.05 with previous time point. $ indicates p < 0.05 between indicated time points. Note: pink boxes refer to consecutive time points at which measurements of the anti-S1 IgG concentration are taken while orange boxes refer to measurements of a subset of patients at time points 4 months, 6 months and 12 months after start of the study (first vaccine dose administration).
Fig. 4
Fig. 4
SARS-CoV-2 anti-S1 IgG antibody titers for infected vs. non-infected cancer patients for different time periods. Boxplots represent log10-transformed SARS-CoV-2 anti-S1 IgG antibody titers for cancer patients infected with SARS-CoV-2 (blue) and non-infected patients (red) during the indicated time periods. A two-sided p-value < 0.05 after Bonferroni-Holm correction for multiple testing was considered statistically significant: *p < 0.05. (A) SARS-CoV-2 anti-S1 IgG antibody titers between 28 days after second vaccine dose and prior to first booster dose (time period E). (B) SARS-CoV-2 anti-S1 IgG antibody titers between first booster administration and 28 days afterwards (time period F). (C) SARS-CoV-2 anti-S1 IgG antibody titers between 28 days and 6 months after first booster dose (time period G). (D) SARS-CoV-2 anti-S1 IgG antibody titers between 6 months after first booster dose and second booster administration (time period H). (E) SARS-CoV-2 anti-S1 IgG antibody titers between 28 days after second booster administration and the end of the study (time period I).

References

    1. Martines, R. B. et al. Pathology and pathogenesis of SARS-CoV-2 associated with fatal coronavirus disease, United States. Emerg. Infect. Dis.26, 2005–2015. 10.3201/eid2609.202095 (2020). - PMC - PubMed
    1. Harrison, A. G., Lin, T. & Wang, P. Mechanisms of SARS-CoV-2 transmission and pathogenesis. Trends Immunol.41, 1100–1115. 10.1016/j.it.2020.10.004 (2020). - PMC - PubMed
    1. Chakraborty, C., Sharma, A. R., Sharma, G., Bhattacharya, M. & Lee, S. S. SARS-CoV-2 causing pneumonia-associated respiratory disorder (COVID-19): Diagnostic and proposed therapeutic options. Eur. Rev. Med. Pharmacol. Sci.24, 4016–4026. 10.26355/eurrev_202004_20871 (2020). - PubMed
    1. Schmidt, A. L. et al. COVID-19 vaccination and breakthrough infections in patients with cancer. Ann. Oncol.33, 340–346. 10.1016/j.annonc.2021.12.006 (2022). - PMC - PubMed
    1. Galmiche, S. et al. Immunological and clinical efficacy of COVID-19 vaccines in immunocompromised populations: A systematic review. Clin. Microbiol. Infect.28, 163–177. 10.1016/j.cmi.2021.09.036 (2022). - PMC - PubMed

MeSH terms