. 2025 Mar 6;15(1):7864.
doi: 10.1038/s41598-025-92409-7.

Autophagy-related biomarkers identified in sepsis-induced ARDS through bioinformatics analysis

Affiliations

Autophagy-related biomarkers identified in sepsis-induced ARDS through bioinformatics analysis

Wei Wang et al. Sci Rep. .

Abstract

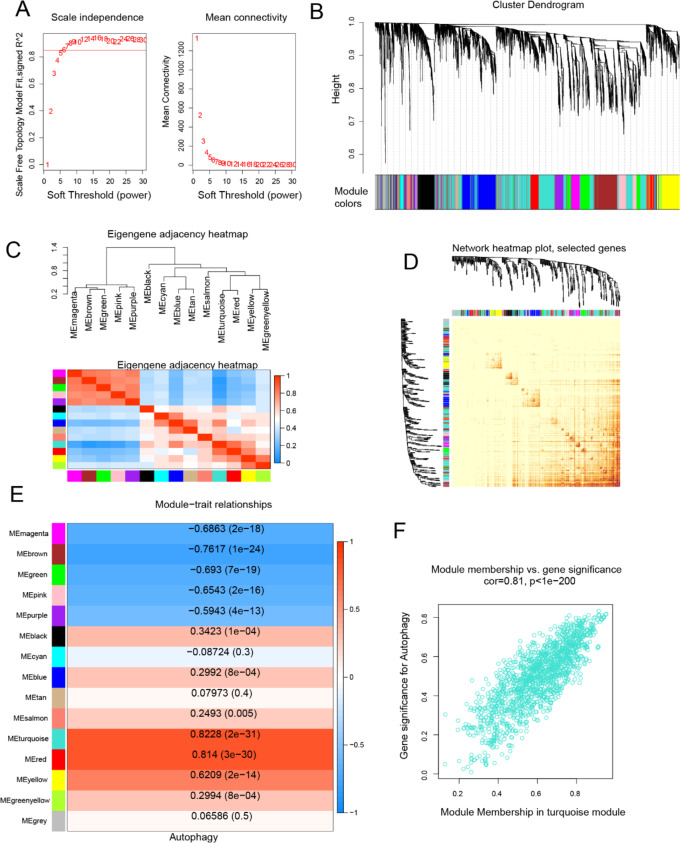
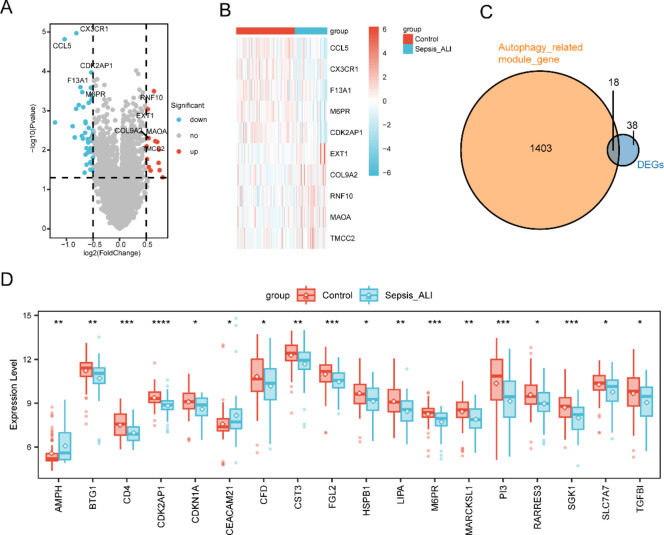
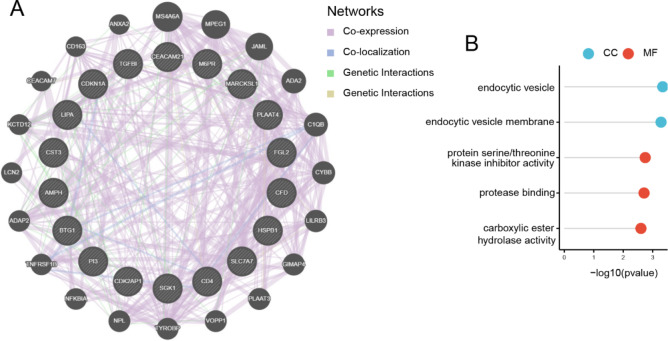
While dysregulated autophagy has been linked to acute respiratory distress syndrome (ARDS) development in sepsis, the exact regulatory mechanisms driving this process remain unclear. This study systematically investigated autophagy-related genes in sepsis-induced ARDS using integrative bioinformatics, including weighted gene coexpression network analysis (WGCNA), differential gene expression analysis (DEGs), receiver operating characteristic (ROC) curve analysis, Gene Ontology (GO) and Kyoto Encyclopedia of Genes and Genomes (KEGG) enrichment analysis, protein‒protein interaction (PPI) network analysis, and immune infiltration analysis. Hub genes were further validated by qPCR in Beas-2B cells receiving lipopolysaccharide (LPS) stimulation. We identified 18 autophagy-related DEGs with diagnostic potential for sepsis-induced ARDS. These DEGs were linked to endocytosis, protein kinase inhibition, and enigmatic Ficolin-1-rich granules. The downregulated hallmark signaling pathways involved apoptosis, complement, IL-2/STAT5, and KRAS signaling. Immune infiltration analysis revealed alterations in 7 immune cell subsets, including CD8 + T-cell exhaustion, natural killer cell reduction, and the type 1 helper T-cell response. When Beas-2B cells were treated with LPS, we discovered that 6 out of the 18 hub genes were significantly downregulated. Our findings provide novel insights into autophagy-mediated ARDS pathogenesis in sepsis. The hub genes represent promising candidates for clinical biomarker development and therapeutic targeting, which necessitates further validation.

Keywords: Acute respiratory distress syndrome; Autophagy; Bioinformatics; Sepsis.


Conflict of interest statement

Declarations. Competing interests: The authors declare no competing interests. Ethical approval and consent to participate: The Ethics Committee of the First Affiliated Hospital, Zhejiang University School of Medicine waived the requirement for ethics approval and consent to participate in this study because it does not involve human subjects, live animals, or sensitive data processing that would typically require ethical oversight.

Figures

Fig. 1
Fig. 1
WGCNA and identification of autophagy-related modules: (A) Network topology under various soft threshold powers. (B) The genes were divided into different modules via hierarchical clustering. (C) Module Relationships: Hierarchical clustering and correlation heatmap of modules, displaying positive correlations in red and negative correlations in blue. (D) Topological overlap: Heatmap indicating topological overlap between genes, with lighter colors indicating lower topological overlap and gradually darker red colors indicating greater topological overlap. (E) Association between modules and autophagy-related genes, with color-coded correlations. (F) MM-GS correlation: Correlation between module membership (MM) and gene significance (GS) for autophagy-related genes in the turquoise module (Cor: absolute correlation coefficient between GS and MM).
Fig. 2
Fig. 2
DEGs in Sepsis-Induced ARDS: (A) Volcano plot of DEGs between the sepsis-induced ARDS group and the control group. (B) Heatmap displaying the top 5 upregulated and 5 downregulated DEGs. (C) Venn diagram illustrating the intersection between autophagy-related genes and DEGs. (D) Boxplots depicting 18 autophagy-related DEGs whose expression differed between the two groups. *P < 0.05, **P < 0.01, ***P < 0.001, ****P < 0.0001.
Fig. 3
Fig. 3
ROC curves of the hub genes (A) CDK2AP1, (B) M6PR, (C) SGK 1, (D) PI3, (E) CD4, (F) FGL2, (G) LIPA, (H) MARCKSL1, (I) BTG1, (J) CST3, (K) AMPH, (L) CDKN1A, (M) SLC7A7, (N) TGFBI, (O) RARRES3, (P) CEACAM21, (Q) HSPB1, (R) CFD.
Fig. 4
Fig. 4
GO enrichment analysis of autophagy-related DEGs. (A) GO terms related to Cellular Component (CC) and associated gene string map. (B) GO terms related to Molecular Function (MF) and associated gene string map.
Fig. 5
Fig. 5
Functional analysis of hub genes: (A) Gene coexpression network diagram; (B) GO analysis of coexpressed genes.
Fig. 6
Fig. 6
Correlations of HALLMARK signaling pathways with autophagy-related hub genes in sepsis-induced ARDS. (A) Comparative analysis of 50 HALLMARK signaling pathways between sepsis-induced ARDS and control groups. Four pathways—HALLMARK APOPTOSIS, HALLMARK COMPLEMENT, HALLMARK IL-2 STAT5 SIGNALING, and HALLMARK KRAS SIGNALING UP—were significantly downregulated in the sepsis-induced ARDS group. (B) Correlation network between top five autophagy-related DEGs and HALLMARK Signaling Pathways. ****P < 0.0001, ***P < 0.001, **P < 0.01, *P < 0.05.
Fig. 7
Fig. 7
Immune landscape characterization in sepsis-induced ARDS. (A) Differential immune cell infiltration. CIBERSORT analysis revealed significant abundance differences (P < 0.05) in 7 immune subsets: activated CD8 T cells, central memory CD4 T cells, effector memory CD8 T cells, MDSCs, NK cells, Tfh cells, and Th1 cells. (B) Heatmap illustrating the overall level of immune cell infiltration across both groups, reflecting systemic immune response engagement. (C) BTG1 expression strongly correlates with central memory CD4 T cells abundance (r = 0.782, P < 0.001). (D) SLC7A7 shows significant association with MDSCs (r = 0.747, P < 0.001). (E) Immune network coordination. Correlation matrix reveals predominant positive associations (red) among immune cell types, highlighting synchronized immune activation in sepsis-induced ARDS. ****P < 0.0001, ***P < 0.001, **P < 0.01, *P < 0.05.
Fig. 8
Fig. 8
Six out of 18 candidate hub genes showed significant downregulation in LPS-treated Beas-2B cells compared to untreated controls.

References

    1. Singer, M. et al. The third international consensus definitions for sepsis and septic shock (Sepsis-3). JAMA315 (8), 801–810 (2016). - PMC - PubMed
    1. Mikkelsen, M. E. et al. The epidemiology of acute respiratory distress syndrome in patients presenting to the emergency department with severe sepsis. Shock40 (5), 375–381 (2013). - PMC - PubMed
    1. Iriyama, H. et al. Risk modifiers of acute respiratory distress syndrome in patients with non-pulmonary sepsis: a retrospective analysis of the FORECAST study. J. Intens. Care. 8, 7 (2020). - PMC - PubMed
    1. Li, S. et al. Prevalence, potential risk factors and mortality rates of acute respiratory distress syndrome in Chinese patients with sepsis. J. Int. Med. Res.48 (2), 300060519895659 (2020). - PMC - PubMed
    1. Nam, H. et al. Nonpulmonary risk factors of acute respiratory distress syndrome in patients with septic bacteraemia. Korean J. Intern. Med.34 (1), 116–124 (2019). - PMC - PubMed