. 2025 Mar;7(3):602-616.
doi: 10.1038/s42255-025-01236-7. Epub 2025 Mar 6.

Dietary protein restriction elevates FGF21 levels and energy requirements to maintain body weight in lean men

Affiliations

Dietary protein restriction elevates FGF21 levels and energy requirements to maintain body weight in lean men

Trine S Nicolaisen et al. Nat Metab. 2025 Mar.

Abstract

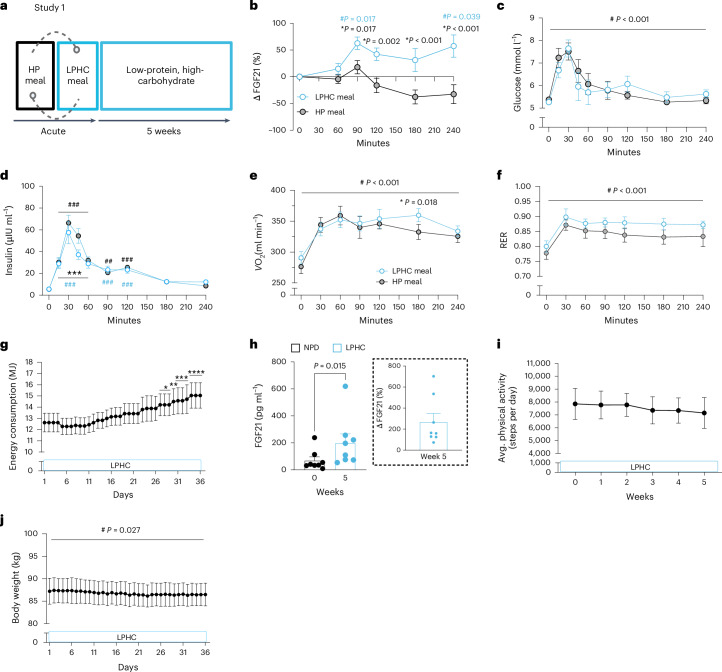
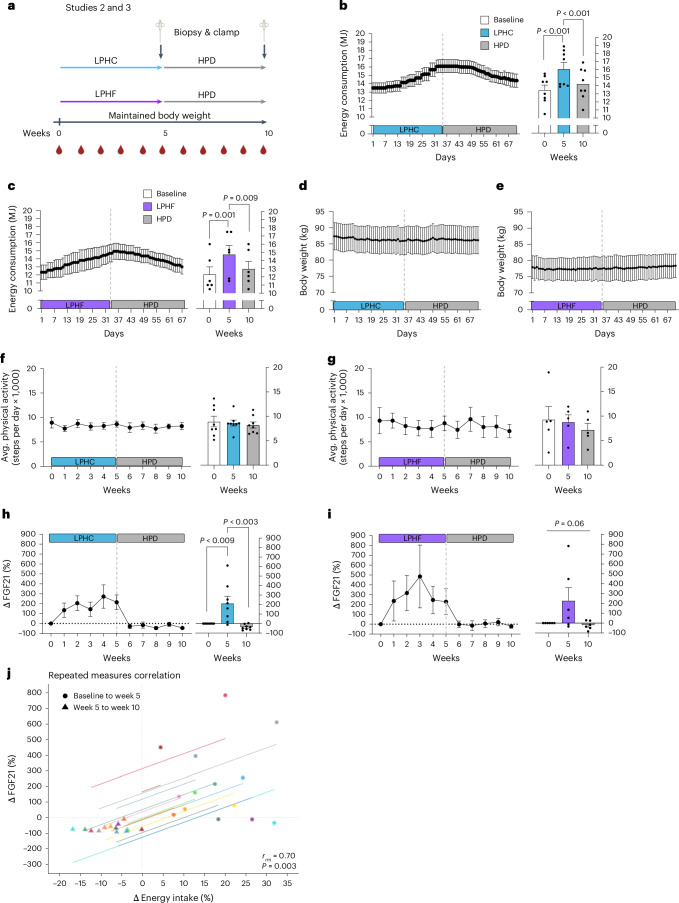
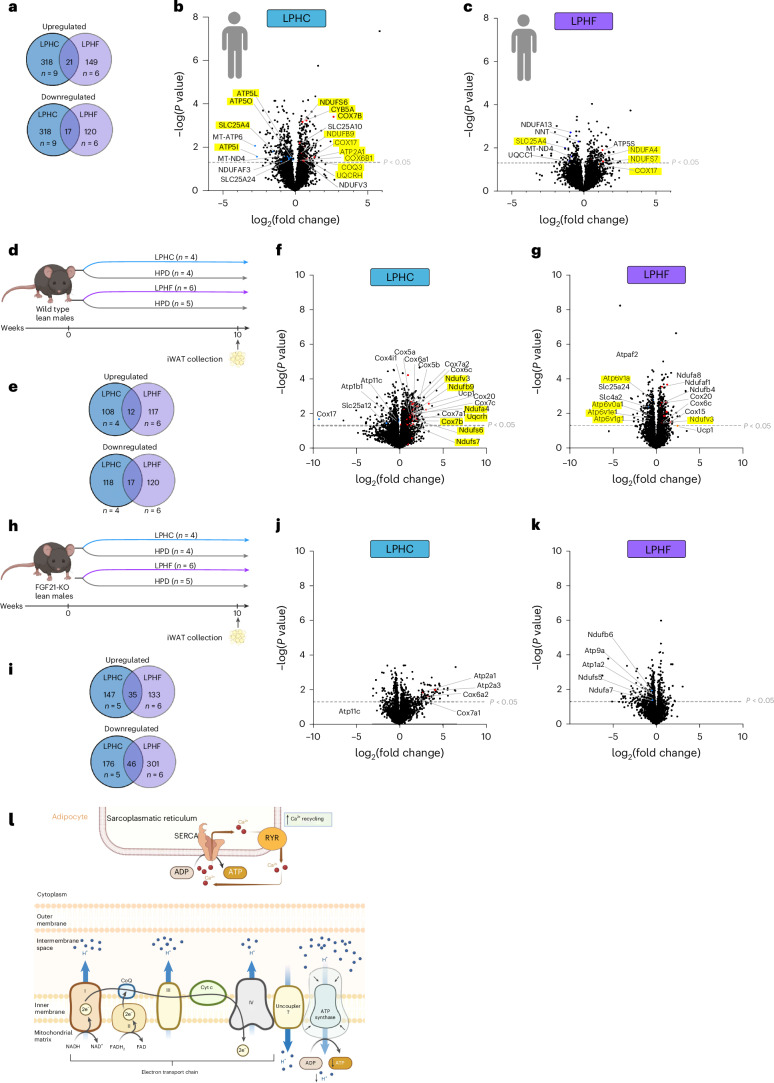
Dietary protein restriction increases energy expenditure and enhances insulin sensitivity in mice. However, the effects of a eucaloric protein-restricted diet in healthy humans remain unexplored. Here, we show in lean, healthy men that a protein-restricted diet meeting the minimum protein requirements for 5 weeks necessitates an increase in energy intake to uphold body weight, regardless of whether proteins are replaced with fats or carbohydrates. Upon reverting to the customary higher protein intake in the following 5 weeks, energy requirements return to baseline levels, thus preventing weight gain. We also show that fasting plasma FGF21 levels increase during protein restriction. Proteomic analysis of human white adipose tissue and in FGF21-knockout mice reveal alterations in key components of the electron transport chain within white adipose tissue mitochondria. Notably, in male mice, these changes appear to be dependent on FGF21. In conclusion, we demonstrate that maintaining body weight during dietary protein restriction in healthy, lean men requires a higher energy intake, partially driven by FGF21-mediated mitochondrial adaptations in adipose tissue.


Conflict of interest statement

Competing interests: The authors declare no competing interests.

Figures

Fig. 1
Fig. 1. Study design.
A three-arm study was performed. In study 1, healthy, lean men ingested either a LPHC meal or a habitual HP meal in a randomized order, separated by 72 h, followed by a 5-week LPHC diet. In studies 2 and 3, participants ingested either a LPHC diet or a LPHF diet for 5 weeks followed by a standard HPD for another 5 weeks. All diets were eucaloric. Resting metabolic rate (RMR) was measured before and after the protein-restricted interventions. A hyperinsulinemic-euglycemic clamp was performed after the protein-restricted and HPD interventions. Basal subcutaneous abdominal fat biopsy was obtained after the protein-restricted and HPD interventions. Graphical illustration created in BioRender.com.
Fig. 2
Fig. 2. Effects of an acute low-protein meal and prolonged protein-restricted diet on circulating FGF21 levels and energy requirements for weight maintenance.
a, Illustration of study 1, in which healthy, lean men ingested a LPHC meal or a habitual HP meal in randomized order followed by a eucaloric LPHC diet for 5 weeks. b, Fasting and postprandial plasma FGF21 level, c, glucose and d, insulin levels. e, Whole-body oxygen uptake. f, RER during the LPHC and HP meal. g, Daily energy provision during the LPHC intervention. h, Fasting plasma FGF21 levels before and after the LPHC intervention. i, Daily number of steps and j, daily measurement of body weight during the LPHC intervention. P values in bf determined by repeated measures two-way ANOVA/mixed-effects model with Bonferroni multiple comparisons test; in g, i and j, repeated measures one-way ANOVA/mixed-effects model with a Bonferroni post hoc test; in h, two-tailed paired t-test. Asterisk (*) indicates difference between diets in d and g (different from day 0): *P < 0.05, **P < 0.01, ***P < 0.001; # indicates effect of time (or main effect of time in c, e, f and j) in d: ##P < 0.01, ###P < 0.001. All data are presented as mean ± s.e.m. Meal test data in b, c, e, f, n = 9; in d, n = 8 owing to insulin analysis issues for one participant. LPHC diet intervention data in gj, n = 8, as one participant only completed the meal test. Source data
Fig. 3
Fig. 3. Effect of dietary protein-restricted diet either rich in carbohydrates or fat on energy balance.
a, Illustration of studies 2 and 3 in healthy, lean men ingesting a eucaloric LPHC or LPHF diet for 5 weeks followed by another 5 weeks on a eucaloric habitual HPD. b,c, Daily energy provision during the LPHC, LPHF and HPD interventions. d,e, Daily measurement of body weight and f,g, number of steps taken during the LPHC, LPHF and HPD interventions (in g, activity recording is missing in one participant because of an allergy to the band). h,i, Change in fasting plasma FGF21 levels during the LPHC, LPHF and HPD interventions. j, rmcorr plot illustrating the association between changes in energy consumption (%) and changes in circulating FGF21 (%). Each subject is presented as a colour and two points; the circles show the difference in energy intake (%) and FGF21 (%) between week 0 (baseline) and week 5 for LPHC and LPHF; the triangles show the difference in energy intake (%) and FGF21 (%) between week 5 and week 10 for HPDs. P values in bi determined by repeated measures one-way ANOVA/mixed-effects model with a Bonferroni post hoc test; in b, c and fi, statistics were only applied to the bar graphs to test for effects of diets. In j, a repeated measures correlation was applied; correlation coefficient (r) and P value are shown in the figure. All data are presented as mean ± s.e.m. LPHC, n = 8; LPHF, n = 6. In g, n = 5 because of technical issues with the accelerometer. In j, n = 14, all participants of studies 2 and 3. Graphical illustration created in BioRender.com. Source data
Fig. 4
Fig. 4. Effect of dietary protein restriction on whole-body insulin sensitivity in healthy, lean men.
a,b, Fasting plasma glucose and c,d, insulin levels during the LPHC, LPHF and habitual HPD interventions. e,f Glucose infusion rate following the LPHC, LPHF and HPD interventions (Av. infusion rate, average infusion rate during the last 60 min). g,h, Hepatic glucose production (HGP) in the basal state and during the hyperinsulinemic-euglycemic clamp following the LPHC, LPHF and HPD interventions. i,j, Delta values of RERs after the LPHC, LPHF and HPD interventions. P values in ad determined by repeated measures one-way ANOVA or g,h repeated measures two-way ANOVA with a Bonferroni post hoc test; in e, f, i and j, two-tailed paired t-test; in af, statistics were only applied to the bar graphs to test for effects of diets. The # represents the effect of insulin. All data are presented as mean ± s.e.m. LPHC, n = 8; clamp data from three subjects (LPHC intervention, study 2) were excluded: one subject fainted after the basal biopsy and two were excluded owing to technical problems during the clamp (LPHC, n = 5). LPHF, n = 6; data on hepatic glucose production is missing from one subject (LPHF, study 3) owing to lack of glucose tracer (n = 5). Source data
Fig. 5
Fig. 5. Adipose tissue proteome after dietary protein restriction in healthy lean men and male mice.
a, Venn diagram showing the upregulated and downregulated proteins in white adipose tissue from healthy lean men after the LPHC and LPHF interventions. b,c, Volcano plot comparing the P value (P < 0.05) and fold change after the LPHC and LPHF interventions relative to the respective habitual HPD intervention. d, Illustration of the study in which WT male mice were fed either a LPHC, LPHF or standard HPD for 10 weeks. e, Venn diagram showing the upregulated and downregulated proteins in iWAT in WT mice after the LPHC and LPHF interventions f,g, Volcano plot comparing the P value (P < 0.05) and fold change after the LPHC and LPHF intervention relative to the HPD intervention in iWAT. Proteins highlighted in b, c, f and g represent proteins of the electron transport chain, which are discussed in the text. h, Illustration of study in which FGF21-KO male mice were fed either a LPHC, LPHF or HPD for 10 weeks. i, Venn diagram showing the upregulated and downregulated proteins in iWAT in FGF21-KO male mice after the LPHC and LPHF interventions. j,k Volcano plot comparing the P value (P < 0.05) and fold change after the LPHC and LPHF interventions relative to the HPD intervention in iWAT. Unadjusted two-sided Student’s t-tests were used to identify differentially regulated proteins between two conditions in all proteome analyses. i, Working hypothesis of how a prolonged protein-restricted diet increases thermogenesis in adipose tissue obtained from lean men. Graphical illustrations created in BioRender.com.
Extended Data Fig. 1
Extended Data Fig. 1. Effects of dietary protein-restriction on plasma FGF21 concentrations.
(a) plasma FGF21 levels during meal test in Low protein, high carbohydrates Study 1 (LPHC (1)) (b) fasting plasma FGF21 levels during low protein, high carbohydrates study 2 (LPHC (2)) and high protein diet (HPD), (c) before, after LPHC (2) and after HPD, (d) fasting plasma FGF21 levels during low protein, high fat (LPHF) and HPD, (e) before, after LPHF and after HPD. Statistics were only applied to bar graphs to test for effects of diet: a Repeated measures Two-way ANOVA. c, e Repeated measures one-way ANOVA with a Bonferroni post hoc test. Data are presented as means ± SEM. in a: n = 9, in b, c: n = 8 and in d, e: n = 6. Source data
Extended Data Fig. 2
Extended Data Fig. 2. Effect of prolonged protein-restricted diet on hormones regulating energy expenditure and amino acid balance.
(a) Illustration of study 2 and 3 in human participants ingesting a eucaloric low-protein, high-carbohydrate (LPHC) or low-protein, high-fat (LPHF) diet for 5 weeks followed by another 5 weeks on a eucaloric habitual higher protein diet (HPD). (b, c) Fasting plasma noradrenaline, and (d, e) T3 levels during the LPHC, LPHF and HPD interventions. (f) Fasting plasma glucagon levels during the LPHC and HPD interventions. (g, h) Fasting plasma total amino acids levels during the LPHC and HPD interventions. (i, j) fasting plasma urea levels during the LPHC, LPHF, and HPD interventions. (k) RER before LPHC, after LPHC and after HPD, (l) RER before LPHF, after LPHF and after HPD. Repeated measures one-way ANOVA/mixed-effects model with Bonferroni post hoc test to test for differences from week 0. Data are presented as means ± SEM. In b, d, f, g, i, k: n = 8 and in c, e, h, j, l: n = 6. Source data
Extended Data Fig. 3
Extended Data Fig. 3. The effect of dietary protein-restriction on resting metabolic rate.
(ac) VO2 baseline and after low protein, high carbohydrates study 1 (LPHC (1)), low protein, high carbohydrates study 2 (LPHC (2)) and low protein, high fat, (LPHF) study, (df) Resting metabolic rate baseline and after LPHC (1), LPHC (2) and LPHF, (gi) Resting metabolic rate related to LBM baseline and after LPHC (1), LPHC (2) and LPHF interventions, (k, j, m) weekly resting metabolic rate during LPHC (1), and LPHC (2) and LPHF followed by high protein diet (HPD). Statistics were applied to bar graphs to test for effect of diets. For ai a two-tailed paired t-test was conducted. ai are presented as means and individual values. jl are presented as individual values. In a, d, g, j: n = 8, in b, e, h, k: n = 8 and in c, f, i, l: n = 6. Source data
Extended Data Fig. 4
Extended Data Fig. 4. Effect of a prolonged protein-restricted diet on HOMA-IR and plasma FGF21 levels, plasma glucose and plasma insulin during a hyperinsulinemic-euglycemic clamp.
(a, b) HOMA-IR during the low-protein, high-carbohydrate (LPHC), low-protein, high-fat (LPHF), and habitual higher protein diet (HPD) interventions. (c, d) Plasma FGF21 levels during a hyperinsulinemic-euglycemic clamp (HEC). (e, f) Plasma glucose concentrations during HEC. (g, h) Plasma insulin concentrations during HEC. a, b Repeated measures one-way ANOVA or in ch repeated measures two-way ANOVA/mixed-effects model with a Bonferroni post hoc test to test for differences between diet interventions. Data are mean ± SEM. In a: n = 8, in b: n = 6. In c, e, g: n = 5, in d, f, h: n = 6. Source data
Extended Data Fig. 5
Extended Data Fig. 5. Effects of a protein-restricted diet on body weight and food intake is FGF21-dependent in mice.
(a) Body weight and (b) food intake in wild type mice fed a low-protein, high-carbohydrate (LPHC) (n = 4), low-protein, high-fat (LPHF) (n = 6) or a standard higher protein diet (HPD) (controls for LPHC; n = 4, controls for LPHF; n = 6) for 12 weeks. (c) Body weight and (d) food intake in FGF21 KO mice fed a LPHC (n = 5), LPHF (n = 6) or HPD (controls for LPHC; n = 5, controls for LPHF; n = 6) diet for 12 weeks. One-way ANOVA with a Bonferroni post hoc test. Data are mean ± SEM. Source data

References

    1. Keller, U. Dietary proteins in obesity and in diabetes. Int. J. Vitam. Nutr. Res.81, 125–133 (2011). - PubMed
    1. Wycherley, T. P., Moran, L. J., Clifton, P. M., Noakes, M. & Brinkworth, G. D. Effects of energy-restricted high-protein, low-fat compared with standard-protein, low-fat diets: a meta-analysis of randomized controlled trials. Am. J. Clin. Nutr.96, 1281–1298 (2012). - PubMed
    1. Magkos, F. The role of dietary protein in obesity. Rev. Endocr. Metab. Disord.21, 329–340 (2020). - PubMed
    1. Astrup, A., Raben, A. & Geiker, N. The role of higher protein diets in weight control and obesity-related comorbidities. Int. J. Obes. (Lond.)39, 721–726 (2015). - PMC - PubMed
    1. Larsen, T. M. et al. Diets with high or low protein content and glycemic index for weight-loss maintenance. N. Engl. J. Med.363, 2102–2113 (2010). - PMC - PubMed

LinkOut - more resources