. 2025 Mar;28(3):558-576.
doi: 10.1038/s41593-025-01871-z. Epub 2025 Mar 6.

Microglia dysfunction, neurovascular inflammation and focal neuropathologies are linked to IL-1- and IL-6-related systemic inflammation in COVID-19

Affiliations

Microglia dysfunction, neurovascular inflammation and focal neuropathologies are linked to IL-1- and IL-6-related systemic inflammation in COVID-19

Rebeka Fekete et al. Nat Neurosci. 2025 Mar.

Abstract

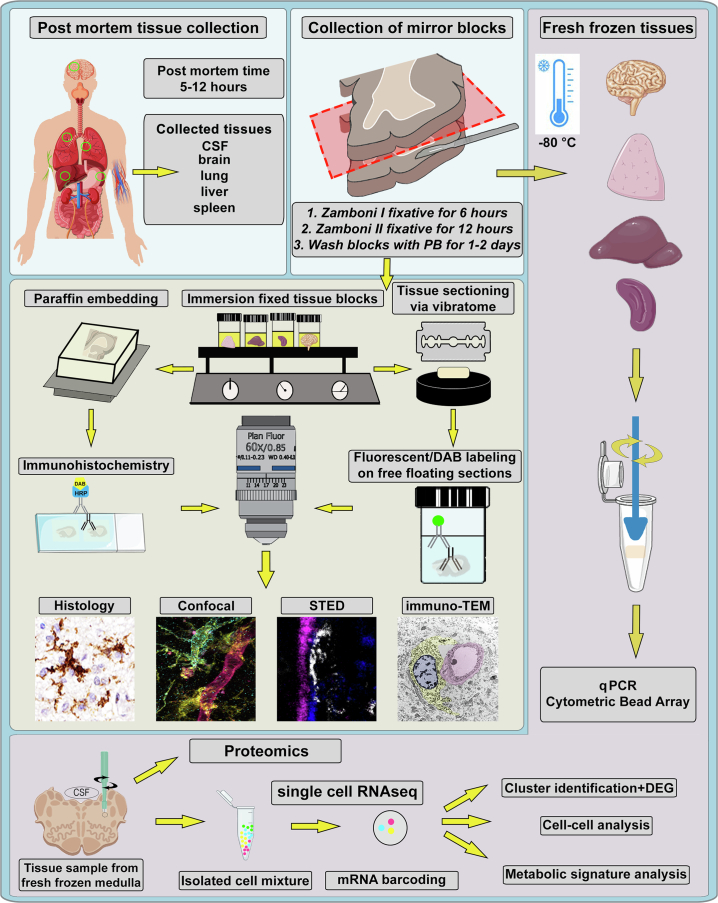
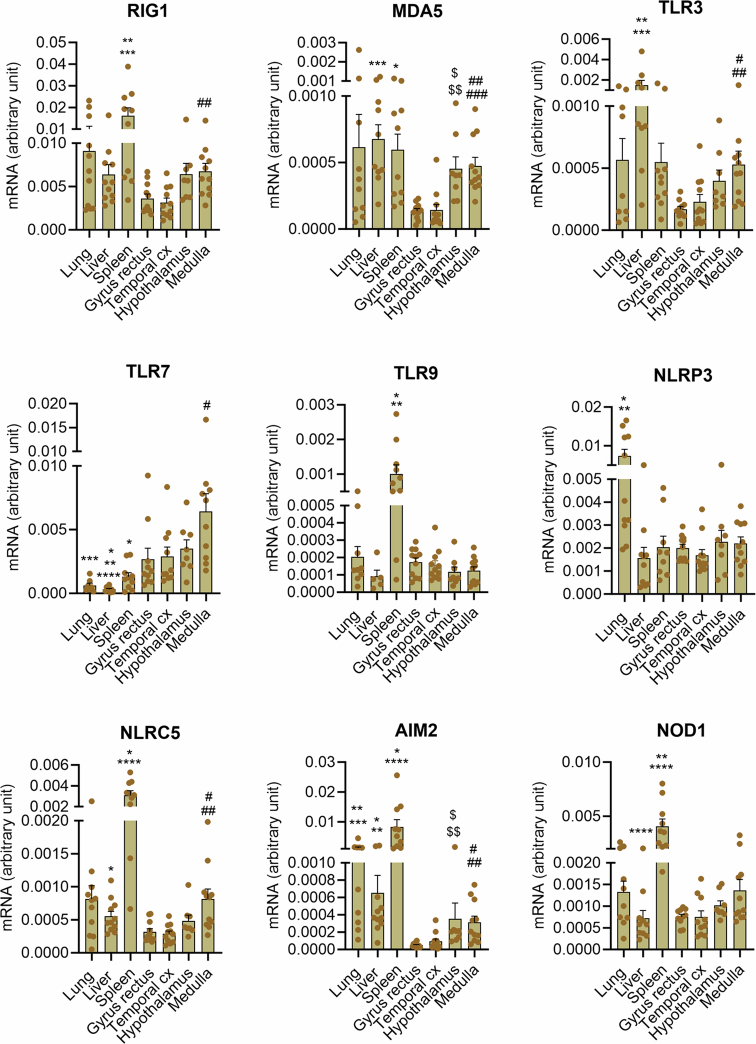
COVID-19 is associated with diverse neurological abnormalities, but the underlying mechanisms are unclear. We hypothesized that microglia, the resident immune cells of the brain, are centrally involved in this process. To study this, we developed an autopsy platform allowing the integration of molecular anatomy, protein and mRNA datasets in postmortem mirror blocks of brain and peripheral organ samples from cases of COVID-19. We observed focal loss of microglial P2Y12R, CX3CR1-CX3CL1 axis deficits and metabolic failure at sites of virus-associated vascular inflammation in severely affected medullary autonomic nuclei and other brain areas. Microglial dysfunction is linked to mitochondrial injury at sites of excessive synapse and myelin phagocytosis and loss of glutamatergic terminals, in line with proteomic changes of synapse assembly, metabolism and neuronal injury. Furthermore, regionally heterogeneous microglial changes are associated with viral load and central and systemic inflammation related to interleukin (IL)-1 or IL-6 via virus-sensing pattern recognition receptors and inflammasomes. Thus, SARS-CoV-2-induced inflammation might lead to a primarily gliovascular failure in the brain, which could be a common contributor to diverse COVID-19-related neuropathologies.


Conflict of interest statement

Competing interests: The authors declare no competing interests.

Figures

Fig. 1
Fig. 1. COVID-19 induces microglial reactivity and focal downregulation of microglial P2Y12R in proportion to viral load.
a, Fluorescent images showing microglial morphology changes (Iba1, yellow) associated with marked loss of neurons (MAP2, red) in a COVID-19 case compared with non-COVID in the olfactory bulb. Iba1 DAB labeling shows marked morphological transformation of microglia at multiple brain areas in COVID-19. b, Representative 3D surfaces and skeletons showing typical microglial morphologies. ce, Automated morphology analysis revealing COVID-19-related changes in microglial phenotypes at different brain sites (two-tailed Mann–Whitney U-test: *P < 0.05, ***P < 0.001, ****P < 0.0001 control versus COVID-19). Changes in cell volume (c), number of branching nodes (d) and sphericity (e) are plotted. Each dot represents a single microglial cell (n = 273 or 181 (control or COVID-19, respectively) in the gyrus rectus (BA11); n = 216 or 175 in the temporal cortex (BA38), n = 97 or 64 in hypothalamus; n = 99 or 127 in the medulla from n = 5 COVID-19 cases and 7 controls). fh, Confocal fluorescent images showing downregulation of microglial P2Y12R in the affected areas of the gyrus rectus (f) and the dorsal medulla (g) (yellow: Iba1, cyan: P2Y12), as revealed by integrated density measurement of P2Y12R labeling (h). ****P < 0.0001, COVID-19 versus control in both brain areas and ####P < 0.0001, COVID-19 gyrus rectus versus COVID-19 medulla, two-way ANOVA followed by Tukey’s post-hoc comparison (n = 2,011 microglia in the gyrus rectus, n = 1,650 microglia in the medulla from n = 4 COVID-19 cases; n = 1,898 microglia in the gyrus rectus; n = 1,550 microglia in the medulla from n = 3 controls). i,j, Spider charts display heterogeneity of microglial P2Y12R loss among 11 COVID-19 cases, showing an arbitrary heterogeneity score based on cell density values in the gyrus rectus (i) and the medulla (j). Blue dots represent normal, Iba1+P2Y12+ microglia and pink dots Iba1+P2Y12 microglia. k, Viral load in the dorsal medulla negatively correlating with P2Y12R mRNA levels (n = 9, where dots represent patients). l, Viral load positively correlating with IFNα mRNA levels in the dorsal medulla (n = 9, where dots represent patients). Correlation graphs show logged data from qPCR with P values and Pearson’s r correlation coefficient displayed. BA, Brodmann area. Scale bars, 50 µm (a widefield microscopy, g), 25 µm (a fluorescent images), 100 µm (f). In c, d, e and h, data are mean ± s.d.
Fig. 2
Fig. 2. Vessel-associated accumulation of viral antigens in the medulla marks sites of microglial P2Y12R loss, vascular pathologies and an IL-1- or -6-related inflammatory response.
a, (i) SARS-CoV-2 nc staining reveals intra- and perivascular profiles (arrowheads) in the dorsal medulla, with both clogged (top left) and morphologically intact (bottom left) blood vessels containing immunopositive profiles (arrowheads). (ii) Blood vessel-associated cells (CD31, green, lectin, blue) showing SARS-CoV-2 nc immunopositivity (red arrowheads). (iii) Blood vessel-associated (lectin, blue) SARS-CoV-2 nc staining (red arrowheads) not colocalizing with αSMA+ (white) smooth muscle cells. b, SARS-CoV-2 profiles showing vascular or perivascular association (bv.) compared with parenchymal sites (par.) in the dorsal medulla (med.) and gyrus rectus (gyr. r.) (n = 15 ROIs from 3 COVID-19 cases). The two-tailed Mann–Whitney U-test was used: ****P < 0.0001 bv. med. versus par. med. and bv. gy. r. versus par. gy. r. c, Disintegration of perivascular structures (*) and the presence of viral antigens (arrowheads) observed beyond the vascular endothelium in larger blood vessels of the medulla. d, Immunoelectron microscopy revealing microglial cell body and processes (yellow) forming physical interactions with blood vessels (pink, arrowheads) and showing disintegrated basement membranes and EPVS (*). e, An EPVS apparent in large vessels compared with microvessels in the COVID-19 medulla. The graph shows the percentage of microvessels (diameter of 7.5–10 µm) and larger vessels (15–40 µm) with an EPVS in the dorsal medulla (n = 11 COVID-19 cases were measured). The two-tailed Mann–Whitney U-test was used: ****P < 0.0001. f, Microglia (Iba1, yellow) associated with inflamed blood vessels (v, lectin, magenta) showing P2Y12R downregulation (cyan, arrowheads) in the medulla. g, Graph showing comparison of microglia with low P2Y12R levels associated (assoc.) with blood vessels (bv) versus nonassociated cells (n = 9 ROIs from 3 representative COVID-19 cases). The two-tailed Mann–Whitney U-test was used: P = 0.004. h, STED microscopy revealing microglial P2Y12R enriched at both perivascular AQP4+ astrocyte endfeet and direct endothelial contact sites in the medulla of control cases (i and ii). However, microglial P2Y12R around inflamed blood vessels is lost in COVID-19 brains (iii, red arrowheads). i, Perivascular CD45+ immune cells (arrowheads) containing SARS-CoV-2 nc contacted and internalized by Iba+ microglia (arrows). v, blood vessel. j, The 3D rendering of perivascular (lectin, blue) microglia (Iba1, yellow) with an internalized, SARS-CoV-2 nc-positive (magenta) cell. k, Iba1+ microglia (yellow, green arrowheads) recruited to an ICAM-1+ blood vessel (cyan) with associated MPO+ leukocytes (white). l, Correlation between ICAM-1 and angiogenin measured by CBA in medullary tissue homogenates. The logged data with P values and Pearson’s r correlation coefficient are displayed (n = 11, where dots represent patients). m, Iba1+ microglia (yellow, green arrows) showing marked morphological transformation recruited to blood vessels (lectin, pink) with intraluminal MPO+ cells (white, green arrowheads). The presence of IgG (blue, white arrows) indicates plasma leakage into the parenchyma. n, Spearman’s correlation matrix showing inflammatory mediators in medullary homogenates (left), in all brain areas examined (gyrus rectus, temporal cortex, hypothalamus, medulla; middle) and the CSF (right). Spearman’s r correlation coefficient values are displayed. prot., protein. o, The pSTAT3 (cyan) in medullary endothelium (lectin, red) and perivascular microglia (Iba1, green). Scale bars, 10 µm (a(i),h(ii left panel),i,j,k,m), 5 µm (a(ii),(iii),d(left panel),f,h(iii upper panel)), 20 µm (c), 1 µm (d(upper right panel),h(i right and bottom panels),o), 2 µm (h(i upper left panel, ii right panels, iii bottom panels)). In b, e and g, the data are presented as mean ± s.d.
Fig. 3
Fig. 3. PRRs link microglial states, viral load and inflammation in the brain and peripheral tissues.
a, Representative images of Iba1+ microglia in the gyrus rectus and the dorsal medulla in control and COVID-19 brains for MDH scores shown in b. b, MDH scores in the dorsal medulla in COVID-19 cases significantly higher compared with those in control tissues, the gyrus rectus and the inferior olive and tractus pyramidalis in the ventral medulla. The Kruskal–Wallis test with Dunn’s multiple-comparison test was, and data were from n = 8–11 COVID-19 cases and n = 6–10 controls: dors.med.(d) versus control gyrus rectus P < 0.0001, dors.med.(d) versus COVID gyrus rectus P = 0.016; dors.med.(d) versus control med.(d) P = 0.015; dors.med.(d) versus inf.olive(o) P = 0.005; dors.med.(d) versus tr.pyr.(p) P = 0.019; dors.med.(d) versus lemn.med.(l) P > 0.999. Data are presented as mean ± s.d. (Please refer to Extended Data Fig. 6 for an explanation of the MDH score and the representative images of lemniscus medialis, inferior olive and tractus pyramidalis.) c, MDH in the medulla (med.) correlating positively with medullary IL-6 levels, CSF IL-6 and IL-1β levels and IL-6 levels in peripheral organs, particularly the spleen. Pearson’s correlation matrix with Pearson’s r correlation coefficient values are displayed. d, SARS-CoV-2 RNA levels measured by qPCR in peripheral organs showing positive correlation with SARS-CoV-2 RNA levels in the brain. Only cases where viral RNA could be detected in the brain were plotted. Spearman’s correlation analysis performed with P values and Spearman’s r are displayed (n = 11). e, Pearson’s correlation matrix with Pearson’s r correlation coefficient value displayed showing positive correlation across RANTES, CD62P and fractalkine levels in the brain tissue (medulla, hypothalamus, gyrus rectus and temporal cortex) (n = 6–10 from a total of 11 COVID-19 cases). Note the negative correlation with viral load in the peripheral organs. f, Pearson’s correlation matrix with Pearson’s r correlation coefficient values displayed showing positive correlation across P2Y12R mRNA, IL-1β mRNA and fractalkine protein levels and mRNA levels of several virus-sensing and inflammasome-forming PRRs. Data are from 11 COVID-19 cases. g, Spearman’s correlation matrix with Spearman’s r correlation coefficient displayed for inflammatory cytokines and relevant virus-sensing and inflammasome-forming PRRs in the lung, liver and spleen also correlated with blood CRP values. Data are from 11 COVID-19 cases. Scale bar, 50 µm.
Fig. 4
Fig. 4. SnRNA-seq reveals microglial dysfunction, mitochondrial failure and disrupted cell–cell interactions in COVID-19.
a, UMAP plot of a total of 16,260 nuclei from human brain dorsal medulla samples on snRNA-seq (10×). Nuclei are colored by identified cell populations. EpCs, endothelial progenitor cells; VSMs, vascular smooth muscle cells. b, UMAP plot of microglia or macrophages (1,345 nuclei), colored by condition. c, Volcano plot showing the up- and downregulated genes in microglia or macrophages between control and COVID-19 samples. The colored genes are P < 0.05 and fold-change > 1.25. d, Total number of interactions (left) and interaction strength (right) of the inferred cell–cell communication networks from control (gray) and COVID-19 (dark green) conditions. e, Differential number of interactions (left) and differential interaction strength (right) among cell populations in the cell–cell communication network between control and COVID-19 samples. Red- and blue-colored edges represent increased or decreased signaling, respectively, in COVID-19 compared with controls. f, All significant interactions (left to right (L-R) pairs) from microglia or macrophages compared with all other cell populations. g, UMAP plot of the microglia or macrophage subset (1,345 nuclei), colored by identified subclusters (left) and UMAP plot of reactive microglia (MG), colored by condition (right). h, Key differentially expressed genes in reactive MG between COVID-19 and control conditions. The colour scale represents the average scaled gene expression. i,j, Percentage of cells positive for P2RY12 (i) and CD163 (j) in reactive MG, split by condition (P < 0.001; χ2 test). k, CD163 immunostaining clearly discriminating PVMs (arrow) from Iba1+CD163 microglia (arrowheads) in COVID-19 medulla. Note that microglial P2Y12R is still detectable to confirm microglial identity despite downregulation in vessel-associated MG, whereas PVMs are P2Y12R. l, Quantitative assessment of MG and PVM numbers in control and COVID-19 medullary samples at sites showing average vascular or microglial pathology (avg. path) and severe pathology (sev. path) (n = 18 ROIs from 5 control patients, n = 12 ROIs from 5 COVID-19 cases with average pathology and n = 16 ROIs from 4 COVID-19 cases with severe pathology). The Kruskal–Wallis test with Dunn’s multiple-comparison test was used: bv-assoc. microglia: control versus severe pathology P < 0.0001; average pathology versus severe pathology P = 0.038; parenchymal microglia: control versus average pathology P = 0.0273, control versus severe pathology P = 0.0123; all microglia: control versus average pathology P = 0.0193; control versus severe pathology P < 0.0001; PVMs: control versus average pathology P = 0.0008; control versus severe pathology P < 0.0001. Data are presented as mean ± s.d. Scale bar, 20 µm.
Fig. 5
Fig. 5. Microglial dysfunction, metabolic failure and mitochondrial injury in COVID-19 brains.
a, Dominant senders, receivers, mediators and influencers in the CX3C communication network (left). Right, significant interactions (L-R pairs) among all cell populations for the CX3C signaling network in control (top) and COVID-19 (bottom) samples. b, Padj values of the differential enrichment of metabolic signatures between control and COVID-19 samples per each cell type. c, Significantly downregulated mitochondrial genes (red, n = 9) in microglia from patients with COVID-19 compared with controls. The colored genes are P < 0.05 and fold-change > 1.25. d, Mitochondrial electron transport chain and identified downregulated mitochondrial genes in COVID-19 microglia per complex. Pie charts show the percentage of differentially expressed mitochondrial genes between control and COVID-19 conditions per cell population e, Microglial mitochondria (Tom20, magenta) in the medulla of patients with COVID-19 showing marked morphological changes compared with control brains (arrowheads). f, Morphologically normal mitochondria (arrowheads) lacking BAX as opposed to BAX+ microglial mitochondria in the medulla (arrows). g, Correlated CLSM/STED of Cytc in healthy mitochondria (TOM20). h, STED microscopy revealing the intramitochondrial localization of Cytc in microglia in the medulla from control patients. i, Efflux of Cytc from microglial mitochondria in the COVID-19 medulla. j, Cytc immunofluorescence labeling ratio (inside mito/outside mito) massively decreased in COVID-19 brains (n = 24 ROIs in 3 control, n = 21 ROIs from 2 COVID-19 cases), Mann–Whitney U two-tailed test was used: P < 0.0001. Data are presented as median ± interquartile range (IQR): control, 8.307 (median 5.0150–15.325 IQR, minimum 1.521, maximum 25.319); COVID: 1.091 (0.926–1.274, minimum 0.690, maximum 3.130). kn, Immunoelectron microscopy showing microglial mitochondria with disrupted morphology in COVID-19 medulla. k, Mitochondria with healthy cristae structure. l, Mitochondrion with calcium-containing, electron-dense deposits (red arrowhead) in the matrix and associated structural damage. m, Mitochondrial image showing inner (imm) and outer membrane (omm) disruption (red arrowheads). n, Mitochondrion with swollen or disappeared cristae. o, Prevalence of mitochondrial abnormalities in control and COVID-19 temporal cortex and medullary samples. The percentage of mitochondria with no (−), one (+), two (++) or three (+++) types of abnormalities (n = 3 control, n = 2 COVID-19 cases, representative of the average condition of each group). p,q, Transmission electron micrograph (TEM) images (left two panels in each row) showing P2Y12R-immunogold-labeled microglia, with mitochondria chosen for electron tomography. The colored 3D model (left) shows mitochondrial morphology in control (p) and COVID-19 (q) medullary samples. The rightmost panels show single virtual sections from electron tomographic volumes. Arrows point to P2Y12R or Iba1 immunogold labeling, which was used to confirm microglial cellular identity. Healthy outer mitochondrial membrane (OMM, red), inner boundary membrane (IBM, blue) and cristae (green) structure can be seen on the 3D models from control tissue, whereas disappearance or swelling of cristae together with a rough OMM and calcium-containing, electron-dense deposits (brown) are apparent on models from COVID-19 tissue. The microglial cell membrane is yellow and nuclear membrane blue on 3D renderings. Virtual sections that are 0.49 nm thick are displayed on the rightmost panels. Scale bars, 5 μm (e), 10 μm (f), 0.5 μm (g), 2 μm (h,i), 100 nm (kn), 1 μm (p,q(left panels)), 500 nm (p,q(second from left panels)), 200 nm (p,q(right panels)).
Fig. 6
Fig. 6. COVID-19 is associated with synapse loss and microglial phagocytosis of myelin and synapses.
a, Images showing P2Y12+ (cyan) CD68 microglia (pink) contacting vGluT1 (blue)–Homer1 (orange) synapses in a non-COVID-19 brain (top), whereas, in COVID-19 brains, P2Y12, CD68+ microglia internalize vGluT1+ or Homer1+ synaptic profiles (arrowheads on bottom). b,c, Significant increase in microglial CD68+ phagolysosome numbers (b) and increased synaptic phagocytosis (c) by microglia in COVID-19 cerebral cortex (n = 25 ROIs from 3 control, n = 26 ROIs from 4 COVID-19 cases). The two-tailed Mann–Whitney U-test was used: b, ****P < 0.0001 and c, ****P < 0.0001. d, STED microscopy showing microglial P2Y12Rs enriched at Kv2.1+ neuronal somatic contact site (somatic junction) in the gyrus rectus of non-COVID-19 cases (top), whereas in COVID-19 brains P2Y12R expression is downregulated at somatic junctions (bottom, n is neuron). e, Microglial P2Y12R+ process contact at vGluT1+ synapses in control brains (top) whereas in COVID-19 brains P2Y12Rs are lost at these synaptic contacts in severely affected areas of the gyrus rectus. f, Transmission electron microsope (TEM) image showing the Iba1+ microglial process contacting a synapse in a COVID-19 brain. The pink arrowheads show tissue loss around the contact site. g, Schematics of tissue preparation for postembedding immunolabeling. h, Confocal fluorescent panels showing postembedding immunolabeling of vGluT1 (pink) and synapsin+ (green) synapses for quantitative assessment. Note the loss of synapses in both average and severe COVID-19 pathology compared with control brains. i, Significant synapse loss in COVID-19 temporal cortex, gyrus rectus and medulla compared with the same brain areas in non-COVID cases (control n = 3, COVID-19 average pathology n = 3; severe pathology n = 3; 4 ROIs per condition). The Kruskal–Wallis test with Dunn’s multiple-comparison test was used: temporal cortex: control versus average pathology P = 0.0043, control versus severe pathology P = 0.0028; gyrus rectus: control versus average pathology P = 0.0002, control versus severe pathology P = 0.0002; medulla: control versus average pathology P = 0.0271, control versus severe pathology P < 0.0001. j, Iba1 DAB immunoperoxidase labeling with Cresyl Violet counterstain showing microglial engulfment of degenerating neuronal cell bodies in the cerebral cortex and medulla of COVID-19 cases. k, Average microglial somatic coverage of degenerating neuronal cell bodies significantly increased in the medulla compared with the gyrus rectus in the same COVID-19 cases. Samples from the gyrus rectus (n = 9) and medulla (n = 9) were selected from the same COVID-19 cases. Dots represents ROIs. * P < 0.05. l, TEM (left) and CLSM images (right) showing frequent associations of microglia with disintegrated myelin sheath, whereas myelin engulfment by microglia also observed in COVID-19 medulla samples. Pink (TEM panel) and white (confocal 3D panel) arrowheads show sites of microglia–myelin interactions and phagocytosis. m, STED images showing healthy axonal profiles in a control patient’s medulla, using immunolabeling for MBP (magenta) and CNP (green). In COVID-19 patients’ samples, three forms of myelin defects could be observed: dilatation, curling and decompaction of the myelin sheath. n, Percentage of healthy axonal profiles are significantly decreased in the brain of patients with COVID-19 (n = 3 control, n = 3 COVID-19 cases with representative severity of myelin pathology in each group). Kruskal–Wallis test with Dunn’s multiple-comparison test was used: gyrus rectus: control versus severe pathology (Severe pathol.) P = 0.0003; temporal cortex: control versus average pathology (Avg. pathol.) P = 0.0033, control versus severe pathology P = 0.0229; hypothalamus: control versus average pathology P = 0.0413, control versus severe pathology P = 0.005; medulla: control versus average pathology P = 0.0413, control versus severe pathology P = 0.005. NS, not significant. Scale bars, 5 µm (a,f,h,j), 500 nm (d,e,m(control)), 3 µm (l(i)), 1 µm (l(ii),m(curling and decompaction)), 250 nm (l(iii)), 2 µm (m(dilatation). In b, c, i, k and n, data are presented as mean ± s.d.
Fig. 7
Fig. 7. Proteomic analysis reveals links across microglial dysfunction, inflammation and neurological states in COVID-19 cases.
a, Proteomic analysis using the Olink platform showing significantly altered proteins in COVID-19 CSF samples (left) and medullary homogenates (right) compared with non-COVID-19 cases. Middle, comparison of upregulation and downregulation of proteins in the CSF versus the medulla normalized to control baseline values with selected proteins displayed. The data are expressed as log10(average fold-change) over control (Mann–Whitney U-test on logged data with FDR correction; data from 11 COVID-19 cases and 9 controls). b, Main molecular pathways affected in COVID-19 cases based on functional enrichment analysis. reg., regulation. c, Spearman’s multiple correlation analysis showing significant associations between proteins regulating core microglial pathways and markers of inflammatory or neurological states. Data are from 11 COVID-19 cases and 9 controls. Spearman’s r is displayed on the heatmaps. d, Spearman’s multiple correlation analysis showing significant associations between NLRs or TLRs and markers of inflammatory or neurological states. Data are from 11 COVID-19 cases and 9 controls. Spearman’s r is displayed on the heatmaps. Correlations based on protein changes from Olink proteomics are shown except for P2Y12R (c) and NLRs or TLRs (d) where mRNA levels measured by qPCR were used in the absence of appropriate protein assays available. e, Most influential proteins showing the SHAP contribution values of the best-performing machine learning models predicting differences between COVID-19 (n = 11 cases) and non-COVID-19 (n = 8–9 samples from 9 controls) samples, aggregated across tissue types. f, Heatmap showing the log(abundance) of the most changed complexes, predicted by the Cytocast platform (Methods). g, STRING protein–protein interaction network of perturbed protein complexes (purple), best COVID-19 predictor proteins (blue), microglial proteins (green), key interleukins identified (red) with IL-18 (pink) additionally revealed by Olink proteomics and PRRs (orange). Other significantly changed proteins are added with gray background. Circles represent proteins measured with Olink proteomics, the size indicating the relative fold-change across all tissues COVID versus control (CSF, medulla, cortex); the triangle is measured by another approach in the present study and the diamond interacting proteins that are not measured. Source data
Fig. 8
Fig. 8. Summary of the main pathological changes in COVID-19 brains and related molecular pathways identified.
We showed that accumulation of viral antigens in intravascular immune cells and perivascular structures is associated with profound vascular inflammation, EPVS, impaired BBB function, increased PVM numbers, focal loss of microglial P2Y12R and CX3CR1–CX3CL1 axis defects at sites of severe neuropathologies that include disintegration of myelin and loss of synaptic proteins. Assessment of inflammatory changes by different, complementary approaches reveal the activation of PRRs (NLRs and TLRs), the development of an IL-1- and IL-6-related proinflammatory response in line with increased production of IL-18 and an antiviral type I IFN response with partially distinct characteristics in the CSF and the brain tissue. SnRNA-seq, proteomics and molecular anatomy data show markedly impaired cell–cell interactions and metabolic failure in the neurovascular unit, loss of core microglial gene signatures, microglial mitochondrial failure and cell death. Among these, we identified changes in the NAD biosynthetic pathway and the possible regulatory role of TGFα among other potentially contributing pathways, including altered SPP1–CD44 interactions or initiation of apoptotic cascades (via Caspase 8, EN-RAGE or other pathways). Of note, central viral load and inflammatory changes show strong association with those revealed in peripheral organs, including an IL-1- and IL-6-related proinflammatory response and production of downstream cytokines and chemokines, suggesting marked impact of systemic inflammatory mechanisms on central inflammation and related neuropathologies.
Extended Data Fig. 1
Extended Data Fig. 1. Post mortem tissue collection platform for correlated studies of inflammatory processes in COVID-19.
Tissue samples were collected from several brain areas and peripheral organs (lung, liver and spleen tissues analysed) of 11 COVID-19 cases with post-mortem CSF samples from all patients. Autopsies were performed 5–12 hours after death. After removal, all tissue blocks were immediately dissected into two parts, one frozen on dry ice for molecular biology studies and the other immersion fixed with Zamboni fixative. Through the whole fixation process tissue blocks were kept on a shaker and the fixative solution was changed in every hour for 6 hours at room temperature. Then, tissue blocks were postfixed for 12 hours, washed with 0.1M PB for 1–2 days and were cut with vibratome or embedded into paraffin for histological assessment. Free floating sections were examined by immunofluorescent labeling and confocal fluorescent laser scanning/superresolution microscopy and EM. FFPE (formalin fixed paraffin embedded) sections were labelled with DAB immunoperoxidase. Sets of frozen tissue samples were processed for qPCR, cytometric bead array and single nuclear RNAseq studies, proteomic analysis was performed on CSF samples and medulla tissue homogenates.
Extended Data Fig. 2
Extended Data Fig. 2. Microglial phenotype transformation and degenerative changes in the brain.
a. Representative images of microglia morphology in control and COVID-19 cases visualized with Iba1 immunostaining (yellow) in the gyrus rectus, temporal cortex, hypothalamus and dorsal medulla. b. Different levels of severity of microglia pathologies associated with a broad range of morphological changes (from elongated to amoeboid microglial states, disintegration of the cells or cell loss) are seen in key central autonomic nuclei and white matter of the dorsal medulla. c. Changes of microglial distribution and P2Y12R levels are shown in control and COVID-19 thalamus. Note focal loss of P2Y12 levels and distribution heterogeneity of microglia in COVID-19 cases. Thalamic nuclei: MD mediodorsal, VL ventral lateral, VPL ventral posterolateral. d. At sites of severe microglial pathologies different microglial states ranging from marked morphological transformation to degeneration and cell loss are seen. Transmission electron microscopic (TEM) images show degenerating microglia in the medulla (yellow pseudocolor). Pink arrowheads show degenerating microglia processes. Scale bars: a-b. 10 µm, c. 5000 µm; 200 µm; d. 5 µm.
Extended Data Fig. 3
Extended Data Fig. 3. Accumulation of viral antigens in the brain parallels the development of type I interferon response and downregulation of microglial P2Y12R.
a. Viral mRNA levels were measured by qPCR and presented as log arbitrary units. One-way ANOVA with Tukey’s post-hoc test (all groups compared): *p<0.05, **p<0.01, ***p<0.001, data from n=11 COVID-19 cases. b. Virus load shows a positive correlation with IFN-α mRNA levels in the gyrus rectus (individual samples where SARS-CoV-2 mRNA levels were detectable were included). Pearson correlation with P values and Pearson r correlation coefficient displayed, n=7. c. IFN-β and IFN-α mRNA levels in tissue homogenates as measured by qPCR. Kruskal-Wallis test with Dunn's multiple comparison (all groups compared): *p<0.05, **p<0.01, ***p<0.001, ****p<0.0001; Kruskal-Wallis test with Dunn's multiple comparison (gyrus rectus vs brain areas): #p<0.05, ##p<0.01, ###p<0.001, ####p<0.0001, n=11 COVID-19 cases. d. SARS-CoV-2 nucleocapsid and S1 protein labelings in lung epithelial cells. Lack of primary antibody eliminates specific immnopositivity for viral antigens on subsequent lung tissue sections. e. Immunodetection of SARS-CoV-2 nucleocapsid (arrowheads) in paraffin embedded bulbus olfactorius with cresyl violet counterstain (left panels). A subset of microglia accumulate viral antigens as visualized by immunofluorescence at infected areas of the bulbus (right panels). f. (i) Cranial nerve IX presents SARS-CoV-2 nucleocapsid immunopositive profiles (arrowheads). (ii) Viral antigens also appear in the vicinity of neurons and other cells outside blood vessels in the dorsal medulla. g. Loss of P2Y12R from vessel-associated microglia and microglial processes (arrowhead) with some P2Y12R retained on microglia away from the vessel (arrow) is shown in the gyrus rectus in a COVID-19 case. h. Perivascular CD15 positive immune cell (green) containing SARS-CoV-2 nucleocapsid (arrowheads), with scattered nucleocapsid staining seen among GFAP-positive astrocyte endfeet. i. Perivascular CD45-positive leukocytes (white, arrowhead) without intracellular viral antigens associated with microglial processes (Iba1, yellow) in the vicinity of SARS-CoV-2–immunopositive cells (magenta, arrow). v- lumen of blood vessel. j. Perivascular CD45-positive immune cells (arrowheads) containing SARS-CoV-2 nucleocapsid are contacted and internalized by Iba-positive microglia (arrows) in the gyrus rectus. Scale bars: d: 100 µm, 10 µm; e: 10 µm; f: 100 µm, 5 µm; g-h: 10 µm; i: 5 µm a, c, Data are presented as mean ± SD.
Extended Data Fig. 4
Extended Data Fig. 4. Vascular inflammation and BBB injury are associated with perivascular microglial pathologies in COVID-19.
a/1. Z1 plane of the confocal stack shows blood vessel (lectin, pink) -associated and intravascular MPO positive immune cells with partially extracellular MMP-9 (green) in the dorsal medulla (dashed line). The Z2 plane 9.5 µm apart showing Iba1 positive microglia (blue) contacting lectin positive vessel with extracellular MMP9 directly at the vessel wall (white arrow). a/2. Iba1 positive microglia (blue) associated with a blood vessel (lectin, pink) with intraluminal MPO positive cell (white, arrowhead) containing MMP9 that is also visualized near the vascular endothelium. b. Intravascular leukocytes in the gyrus rectus are associated with MMP9. c. Intravascular MPO-positive leukocytes (arrowheads) associate with IgG and vessel-associated microglia (arrows) in the gyrus rectus. d. Microglia with markedly altered morphology (Iba1, yellow, green arrows) are recruited to sites of parenchymal IgG deposition (red) in the hypothalamus. e. Extravascular IgG accumulation (red) in the gyrus rectus, temporal cortex, hypothalamus and medulla was visualized by immunofluorescence in COVID-19 cases. f. Integrated density of tissue IgG levels compared across different brain areas in 7 COVID-19 cases with comparable immunogenicity for IgG. Levels of IgG in the medulla are significantly higher compared to hypothalamus ***p<0.001, temporal cortex ****p<0.0001 and gyrus rectus ***p<0.001; data from 7 COVID-19 cases. One-way ANOVA, Kruskal-Wallis test with Dunn’s multiple comparison. g. Blood vessel with extravascular IgG accumulation (while arrowheads) and intraluminal MPO-positive cells (white) are shown in the dorsal medulla. Right panels show inserts inside white quadrants with substantial parenchymal IgG accumulation. h. Numbers of intravascular MPO positive cells show positive correlation with tissue IgG levels in the medulla of COVID-19 cases. Pearson correlation with P values and Pearson r correlation coefficient displayed; n=8 COVID-19 cases. i. Disintegration of aquaporin-4 positive (APQ4, green) astrocyte endfeet around the vasculature can be detected in the dorsal medulla of COVID-19 cases both with average pathology and severe pathology compared to controls. j. Integrated density values of APQ4 are markedly reduced in average (****p<0.0001) and severe (****p<0.0001) COVID-19 pathology in the dorsal medulla comapred to controls (30 ROIs from n=3 controls, 40 ROIs from n=4 COVID-19 cases with average (Avg.) pathology and 50 ROIs from n=5 COVID-19 cases showing severe pathology with integrated density values displayed) Kruskal-Wallis test with Dunn’s multiple comparison. k. Perivascular Iba-1 positive microglia (yellow, green arrowheads) expressing the pro-inflammatory cytokine IL-1α (blue) in close proximity to an intraluminal MPO-positive leukocyte (white) in the dorsal medulla. Note that IL-1α is also expressed by MPO-positive cells (arrow). l. The pro-inflammatory cytokine IL-1ß (blue) is expressed in Iba-1 positive microglia (yellow). Scale bars: a, b, c, d: 10μm; e, g: 100 μm; i: 5 μm k, l: 5 μm. f, j, Data are presented as mean ± SD.
Extended Data Fig. 5
Extended Data Fig. 5. Inflammatory mediators in the brain and peripheral tissues in COVID-19 cases.
a. Cytokine and chemokine levels were measured by cytometric bead array in tissue homogenates (blue bars, left Y axis, expressed as pg/mg protein) and in the CSF (gray bar, right Y axis, expressed as pg/ml), n=11 COVID-19 cases. Cytokines TNFα, IFNγ and IL-17A were below detection levels in most tissues (not shown). b. IL-1β, IL-1α, IL-6 and CX3CL1 mRNA levels were measured by qPCR in tissue homogenates. Kruskal-Wallis test with Dunn's multiple comparisons (all groups compared): *p<0.05, **p<0.01, ***p<0.001, ****p<0.0001; brain areas compared: #p<0.05, ##p<0.01, ###p<0.001, ####p<0.0001 vs medulla; $p<0.05, $$p<0.01, $$$p<0.001 vs hypothalamus, n=11 COVID-19 cases. Refer to Supplementary Table 2 for details on significant differences between groups and related P values. a, b, Data are presented as mean ± SEM.
Extended Data Fig. 6
Extended Data Fig. 6. Description of microglial distribution heterogeneity score.
a. Microglial distribution heterogeneity (MDH) score showing the deviation of microglial numbers measured in given regions within a brain area from the average microglial numbers in that area based on the distribution of Iba1 immunofluorescent profiles. High MDH score indicates high level of distribution heterogeneity (that is marked dislocation of parenchymal microglia). b. Representative images of the lemniscus medialis, oliva inferior and tractus pyramidalis for MDH score measurements (quantification is presented in Fig. 3b). Scale bar: a. 1000 µm, b. 20 µm.
Extended Data Fig. 7
Extended Data Fig. 7. Expression of pattern recognition receptors in the brain and peripheral tissues in COVID-19 cases.
mRNA levels of different PRRs were measured by qPCR in tissue homogenates. Kruskal-Wallis test with Dunn's multiple comparisons (all groups compared): *p<0.05, **p<0.01, ***p<0.001, ****p<0.0001; brain areas compared: #p<0.05, ##p<0.01, ###p<0.001 vs medulla; $p<0.05, $$p<0.01 vs hypothalamus. Data from n=11 COVID-19 cases. Refer to Supplementary Table 2 for details on significant differences between groups and related P values. Data are presented as mean ± SEM.
Extended Data Fig. 8
Extended Data Fig. 8. Single cell RNA sequencing in the medulla of control and COVID-19 cases.
a. Uniform Manifold Approximation and Projection (UMAP) plot of a total of 16260 cells, colored by identified populations (same as Fig. 4a) in control and COVID cases. b. Dot plot showing the expression profile of selected key genes for the identification of all brain cell populations. The dot size corresponds to the fraction of cells within each condition expressing the indicated transcript, and the color indicates average expression. c. SPP1 signaling pathway network analysis. d. Heatmap showing key differential expressed genes for each identified microglia/macrophages cluster. Scale bar represents average scaled gene expression.
Extended Data Fig. 9
Extended Data Fig. 9. Proteomic analysis of inflammatory protein levels in CSF and dorsal medulla.
a. Proteomic analysis by the Olink platform showing quantitative changes of selected proteins in the CSF and dorsal medulla indicative of altered microglial states, inflammation and neurodegeneration (Mann-Whitney test on logged data, refer to the heatmap in Fig. 7a and Supplementary Table 2 for the full list of significantly altered proteins and statistics). Note the opposite CSF vs brain tissue regulation of key proteins shaping core microglial phenotypes (for example CX3CL1, CSF1, CD200/CD200R1, CD40). b. Significantly altered proteins in COVID-19 temporal cortex homogenates (right) compared to non-COVID-19 (Control) cases, Mann-Whitney two-tailed test on logged data with FDR correction. Data from n=11 samples from COVID-19 cases and n=9 samples from controls. Refer to Supplementary Table 2 for statistical details. a, Data are presented as mean ± SEM. Source data
Extended Data Fig. 10
Extended Data Fig. 10. Protein expression changes in the CSF in COVID-19.
a. Volcano plots showing proteins with significantly altered expression levels (green and blue dots) in the CSF of COVID-19 patients compared to CSF of control (upper panel) and AD (lower panel) cases (COVID-19 cases n=11, Control cases n=9, AD cases n=7) using Mann-Whitney two-tailed test. Colored proteins are p<0.05 and |fold change|>1.25. b. Correlation graph shows that COVID-19 causes universal protein changes compared to both control (x-axis) and AD (y-axis) cases. Pearson R is indicated in the graph. AD: Alzheimer’s disease.

References

    1. GBD 2019 Stroke Collaborators Global, regional, and national burden of stroke and its risk factors, 1990–2019: a systematic analysis for the Global Burden of Disease Study 2019. Lancet Neurol.20, 795–820 (2021). - PMC - PubMed
    1. Najt, P., Richards, H. L. & Fortune, D. G. Brain imaging in patients with COVID-19: a systematic review. Brain Behav. Immun. Health16, 100290 (2021). - PMC - PubMed
    1. Maiese, A. et al. SARS-CoV-2 and the brain: a review of the current knowledge on neuropathology in COVID-19. Brain Pathol.31, e13013 (2021). - PMC - PubMed
    1. Conway, E. M. et al. Understanding COVID-19-associated coagulopathy. Nat. Rev. Immunol.22, 639–649 (2022). - PMC - PubMed
    1. Goshua, G. et al. Endotheliopathy in COVID-19-associated coagulopathy: evidence from a single-centre, cross-sectional study. Lancet Haematol.7, e575–e582 (2020). - PMC - PubMed