Multicenter Study
. 2025 Mar 6;16(1):2262.
doi: 10.1038/s41467-025-56505-6.

Deep learning-driven pulmonary artery and vein segmentation reveals demography-associated vasculature anatomical differences

Affiliations
Multicenter Study

Deep learning-driven pulmonary artery and vein segmentation reveals demography-associated vasculature anatomical differences

Yuetan Chu et al. Nat Commun. .

Abstract

Pulmonary artery-vein segmentation is critical for disease diagnosis and surgical planning. Traditional methods rely on Computed Tomography Pulmonary Angiography (CTPA), which requires contrast agents with potential health risks. Non-contrast CT, a safer and more widely available approach, however, has long been considered impossible for this task. Here we propose High-abundant Pulmonary Artery-vein Segmentation (HiPaS), enabling accurate segmentation across both non-contrast CT and CTPA at multiple resolutions. HiPaS integrates spatial normalization with an iterative segmentation strategy, leveraging lower-level vessel segmentations as priors for higher-level segmentations. Trained on a multi-center dataset comprising 1073 CT volumes with manual annotations, HiPaS achieves superior performance (dice score: 91.8%, sensitivity: 98.0%) and demonstrates non-inferiority on non-contrast CT compared to CTPA. Furthermore, HiPaS enables large-scale analysis of 11,784 participants, revealing associations between vessel abundance and sex, age, and diseases, under lung-volume control. HiPaS represents a promising, non-invasive approach for clinical diagnostics and anatomical research.


Conflict of interest statement

Competing interests: The authors declare no competing interests. Ethics: The patient data were collected from The First Affiliated Hospital of Harbin Medical University, the Fourth Affiliated Hospital of Harbin Medical University, Mudanjiang First People’s Hospital, China-Japan Friendship Hospital, Shanghai Renji Hospital, and Guangdong Provincial People’s Hospital, following the approval from the Institutional Review Board. The experiment using DSCTPA was approved by the Fourth Affiliated Hospital of Harbin Medical University. The study was also approved by the Institutional Biosafety and Bioethics Committee at King Abdullah University of Science and Technology. Informed consent was waived in the training cohort and the inpatient cohort due to the retrospective nature of the study. Datasets used were anonymised and any sensitive privacy information was systematically removed.

Figures

Fig. 1
Fig. 1. Illustration of the overall study design.
a Schematic plot for developing and evaluating HiPaS. HiPaS is designed for whole pulmonary artery-vein segmentation on both non-contrast CT and CTPA. Initially, HiPaS was pretrained using 17,817 public CT volumes and subsequently trained on 875 CT volumes, comprising 315 CTPA and 560 non-contrast CT. We utilized 198 external CT volumes for model testing. HiPaS was finally deployed on a clinical cohort of 11,784 patients for anatomical studies. b Overall framework of artery-vein segmentation with HiPaS. The HiPaS framework begins with the Inter-and-Intra Slice Super-Resolution (I2SR) module, which resamples CT scans into a normalized space. Following this, the Saliency-Transmission Segmentation (STS) module is used to achieve precise artery-vein segmentation. c General structures of the I2SR module and the STS module. d Data annotation process. We employed a human-in-the-loop strategy for data annotation. Initially, annotations were created for CTPA. HiPaS was trained on these annotations and then deployed on non-contrast CT to generate initial artery-vein segmentation results. Radiologists then reviewed and revised these results to obtain the final segmentation annotations. e Datasets for pulmonary anatomical study. We collected 11,784 CT volumes from six different cities in China as a multi-center study. Some of the designs in the figure use materials from Freepik https://www.Freepik.com.
Fig. 2
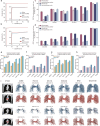
Fig. 2. External testing on the non-contrast CT of the Guangzhou cohort.
Receiver operating characteristic (ROC) curves of pulmonary arteries and veins on normal-resolution CT (NRCT) (a) and low-resolution CT (LRCT) (b). We zoom in on the ROC curve near the top left corner for better visualization. c, d Performance comparison with existing methods in terms of dice similarity coefficient (DSC) for whole arteries and veins, as well as intrapulmonary arteries and veins on both NRCT (n = 142) and LRCT (n = 56). The error bars here and below indicate 95% Confidence Interval (CI), and the center for the error bars indicates average values. e, f Comparison with existing methods in terms of detected proportion of skeleton length and branch counts for arteries and veins on NRCT (n = 142). g, h Comparison with existing methods in terms of the detected ratio of skeleton length and branch counts for arteries and veins on LRCT (n = 56). The CT scans and illustrations merged with artery-vein segmentation. Arteries are marked with blue color and veins are marked with red. We also show the 3D rendering of the arteries (first row) and veins (second row) segmentation results on NRCT (i) and LRCT (j) achieved by different methods. HiPaS can achieve more consistent results with ground truth with more abundant vessel branches. Source data are provided as a Source Data file.
Fig. 3
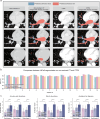
Fig. 3. Segmentation comparison against CTPA, and clinical evaluation for HiPaS.
a Comparison of artery-vein segmentation on paired non-contrast CT and CTPA achieved from DSCTPA. HiPaS can identify arteries and veins directly from non-contrast CT, whose performance is non-inferior to the segmentation on CTPA. b Quantitative comparison of segmentation results between non-contrast CT and paired CTPA from the same patient. Dice similarity coefficient (DSC) is calculated in three scenarios: (1) between segmentation on non-contrast CT and the corresponding annotations; (2) between segmentation on CTPA and the corresponding annotations; and (3) between segmentation from non-contrast CT and CTPA. c Clinical evaluation of HiPaS. Three radiologists from distinct hospitals independently assessed the segmentation results derived from the three methods, nnUNet, semi-automatic segmentation, and HiPaS. The specific method corresponding to the segmentation results remained undisclosed to the radiologists, ensuring unbiased evaluations. The assessment encompassed three key indicators: segmentation accuracy and robustness, vessel branch abundances, and diagnostic assistance (n = 50). Error bars show the standard error of mean (SEM) and the center for the error bars indicates average values. One-side Mann-Whitney U tests were done between each method. P-values are specified as ∗p < 0.05, ∗∗p < 0.01, ∗∗∗p < 0.001, ∗∗∗∗p < 0.0001, NS, not significant. Source data are provided as a Source Data file.
Fig. 4
Fig. 4. Association of vessel abundance with sex and age on 11,784 participants.
We include four indices, skeleton length of pulmonary artery (SLPA), skeleton length of pulmonary vein (SLPV), branch count of pulmonary artery (BCPA), and branch count of pulmonary vein (BCPV) to represent the blood vessel abundance, and used the lung volume as the controlling. a Boxplot of the distribution of four indices between males and females (n = 11,784). The box plot displays data distribution where the box bounds (Q1 and Q3) represent the 25th and 75th percentiles, and the center line indicates the median (50th percentile). The whiskers extend to the minima and maxima, defined as the smallest and largest values within 1.5 times the interquartile range. Two-sided Wilcoxon Signed Ranked tests are done between males and females. P-values are specified as ∗p < 0.05, ∗∗p < 0.01, ∗∗∗p < 0.001, ∗∗∗∗p < 0.0001, NS, not significant. b Pulmonary vessel abundance across different ages. Error bars show the standard error of mean (SEM) (n = 11,784). c Association and linear regression of vessel abundance compartments with lung volume. d Numbers of confirmed disease states for the involved participants. “PAH” = pulmonary artery hypertension, “COPD” = chronic obstructive pulmonary disease. e, f Association between vessel abundance. ((e) for skeleton length and (f) for branch counts) compartments with disease states. Values of the regression coefficients are indicated by colors. The P-values are derived from multiple linear regression analysis, indicating the statistical significance of each independent variable. P values are specified for each item. Source data are provided as a Source Data file.

References

    1. Nabel, E. G. Cardiovascular disease. N. Engl. J. Med.349, 60–72 (2003). - PubMed
    1. Tarride, J. E. et al. A review of the cost of cardiovascular disease. Can. J. Cardiol.25, e195–e202 (2009). - PMC - PubMed
    1. Ye Y. et al. Prevalence, incidence, and survival analysis of interstitial lung diseases in Hong Kong: a 16-year population-based cohort study. Lancet Reg. Health–West. Pac., 42 (2024) - PMC - PubMed
    1. Goldhaber, S. Z. & Morrison, R. B. Pulmonary embolism and deep vein thrombosis. Circulation106, 1436–1438 (2002). - PubMed
    1. McLaughlin, V. V. & McGoon, M. D. Pulmonary arterial hypertension. Circulation114, 1417–1431 (2006). - PubMed

Publication types

LinkOut - more resources