. 2025 Apr;17(4):722-746.
doi: 10.1038/s44321-025-00209-3. Epub 2025 Mar 6.

AAV-mediated expression of proneural factors stimulates neurogenesis from adult Müller glia in vivo

Affiliations

AAV-mediated expression of proneural factors stimulates neurogenesis from adult Müller glia in vivo

Marina Pavlou et al. EMBO Mol Med. 2025 Apr.

Abstract

The lack of regeneration in the human central nervous system (CNS) has major health implications. To address this, we previously used transgenic mouse models to show that neurogenesis can be stimulated in the adult mammalian retina by driving regeneration programs that other species activate following injury. Expression of specific proneural factors in adult Müller glia causes them to re-enter the cell cycle and give rise to new neurons following retinal injury. To bring this strategy closer to clinical application, we now show that neurogenesis can also be stimulated when delivering these transcription factors to Müller glia using adeno-associated viral (AAV) vectors. AAV-mediated neurogenesis phenocopies the neurogenesis we observed from transgenic animals, with different proneural factor combinations giving rise to distinct neuronal subtypes in vivo. Vector-borne neurons are morphologically, transcriptomically and physiologically similar to bipolar and amacrine/ganglion-like neurons. These results represent a key step forward in developing a cellular reprogramming approach for regenerative medicine in the CNS.

Keywords: AAV Vectors; Müller Glia; Neurogenesis; Reprogramming; Retina.


Conflict of interest statement

Disclosure and competing interests statement. Some of the findings in this report are part of a patent application that has been submitted by the University of Washington: Patent Application 63/362,361 filed 4 January 2022. TAR is a co-founder of Tenpoint Therapeutics Ltd. The remaining authors declare no competing interests.

Figures
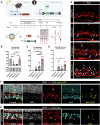
Figure 1
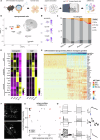
Figure 1. AAV-borne Ascl1 expression in MG stimulate their proliferation and neurogenesis of bipolar-like neurons.
(A) Schematic of experimental concept and timeline of each intervention in vivo. (B) Bar plot of transduction efficiency per condition quantified as the percentage ratio of GFP+TdT+ cells over all TdT+ with each dot being a biological replicate. (C) Bar plot of MG proliferation counted as a ratio of EdU+TdT+ over all TdT+ cells with each dot being a biological replicate. (D) Bar plot of MG reprogramming counted as a ratio of Otx2+TdT+ over all TdT+ cells with each dot being a biological replicate. (E) Fluorescence images of MG proliferation per condition showing EdU in white and TdT in red, with double-labeled examples indicated with white arrows. (F, G) Fluorescence images of reprogrammed cells (white arrows) per condition showing merged and single channels of DAPI in white, TdT in red, Otx2 in cyan and Ascl1 or EdU in yellow; error bars for bar plots: mean plus standard deviation, statistical significance based on ordinary one-way ANOVA with Tukey’s multiple comparisons test (significance P < 0.05, * = 0.05, ** = 0.01, *** = 0.001, **** = 0.0001), scale bar for (E): 50 μm, (F, G): 20 μm. Source data are available online for this figure.
Figure 2
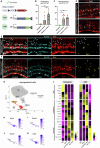
Figure 2. Transcriptional and functional profiling of AAV-mediated reprogramming.
(A) Schematic of the experimental pipeline. (B) UMAP of integrated scRNA-seq data from AAV-borne Ascl1 and control vectors clustered by cell type. (B’) Feature plots of subset reprogrammed clusters showing the level of expression for AAV receptor genes. (C) Alluvium plot of each vector condition showing the proportion of clusters NPre, MG-derived bipolar cells (BC-like), MG and reactive MG (rMG) across samples. (D) Heatmaps of average gene expression level for select glial, progenitor and neuronal markers in rows and integrated scRNA-seq data clusters in columns from published transgenic (Jorstad et al, ; Pavlou et al, 2024) or AAV reprogramming experiments. (E) Heatmap of gene expression across pseudotime of AAV-mediated reprogramming fitted to the top 40 differentially expressed genes identified from transgenic scRNA-seq data plotted across pseudotime as they shift from glial to neurons. (F) Fluorescent images of representative cells (α and γ, white arrows) in live retina slices used for patch-clamp recordings. (G) Scatterplot of current–voltage linearity relative to light response amplitude for GFP+ reprogrammed cells and GFP control cells, from retina samples treated with the high-titer AAV/CBh[Ascl1] where red dots indicate example cells α β γ whose profiles are shown in (G’), (G’) from left to right, family of voltage responses to current steps, family of current responses to voltage steps, and voltage responses to a brief light flash at the time of the arrow. Scale bar for (F): 20 μm. Source data are available online for this figure.
Figure 3
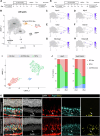
Figure 3. AAV-borne Ascl1-Atoh1/7 expression induces neurogenesis that phenocopies transgenics.
(A) Schematic of AAV vectors and their transgene cassette. (B) Bar plot of MG proliferation counted as a ratio of EdU+TdT+ over all TdT+ cells with each dot being a biological replicate. (C) Bar plot of MG reprogramming counted as a ratio of HuC/D+TdT+ over all TdT+ cells with each dot being a biological replicate. (D) Fluorescence images of MG proliferation per condition showing EdU in white and TdT in red. (E, F) Fluorescence images of reprogrammed cells (white and orange arrows) per condition showing merged and single channels of HuC/D in cyan, TdT in red, and EdU in yellow. (G) UMAP of integrated scRNA-seq data from AAV-borne Ascl1-Atoh1/7 clustered by cell type and highlighting reprogrammed clusters in orange/red. (HK) Feature plots of subset reprogrammed clusters showing the level of expression for the gene annotated above each plot. (L) Heatmaps of average gene expression level for select glial, progenitor, and neuronal markers in rows and integrated scRNA-seq data clusters in columns from published transgenic (Pavlou et al, ; Todd et al, 2021) or AAV reprogramming experiments; error bars for bar plots: mean plus standard deviation, statistical significance based on ordinary one-way ANOVA with Tukey’s multiple comparisons test (significance P < 0.05, * = 0.05, ** = 0.01, *** = 0.001, **** = 0.0001), scale bars for (DF): 50 μm, ONL outer nuclear layer, INL inner nuclear layer, GCL ganglion cell layer. Source data are available online for this figure.
Figure 4
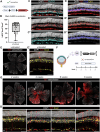
Figure 4. The impact of AAV incubation time on neurogenesis.
(AA’) Schematic of the experimental timeline where AAV is incubated for 2- or 6-weeks. (B) UMAP of integrated scRNA-seq data from AAV reprogramming experiments from all timepoints and vectors clustered by cell type. (CH) Feature plots of integrated UMAP from (A) showing the level of expression for the gene annotated above each plot with reprogrammed clusters circled. (I) Reclustered UMAP of reprogrammed cells after integrating all AAV-borne reprogrammed cells for both timepoints. (J) Alluvium plots of each vector-derived cargo (Ascl1 or Ascl1-Atoh1) showing the percentage of each cell cluster in samples of 2- or 6-week AAV incubation from data subset shown in (I). (K) Fluorescence images of reprogrammed cells (white arrows) per condition showing merged and single channels of DAPI in white, TdT in red, Pcp4 in cyan, and EdU in yellow; scale bar: 20 μm. Source data are available online for this figure.
Figure 5
Figure 5. Comparative analysis of AAV-borne neurons and endogenous neurons.
(A) Heatmap of top ten differentially expressed genes for BC subtypes in adult mouse retina post NMDA (Hoang et al, 2020) and their corresponding expression pattern across AAV-reprogrammed cell clusters grouped by vector treatment. (B) Heatmap of top 10 differentially expressed genes for AC/RGC subtypes in adult mouse retina post NMDA (Hoang et al, 2020) and their corresponding expression pattern across AAV-reprogrammed cell clusters grouped by vector treatment. (C, D) Integrated UMAP of scRNA-seq data from P14 mouse retina (Li et al, 2024) and AAV-reprogrammed cells showing the distribution overlap for (C) AAV/Ascl1 and (D) AAV/Ascl1-Atoh1/7 vector treatment across early postnatal cell clusters. (E, F) Integrated UMAP of scRNA-seq data from E14 mouse retina (Clark et al, 2019) and AAV-reprogrammed cells showing the distribution overlap for (E) AAV/Ascl1 and (F) AAV/Ascl1-Atoh1/7 vector treatment across developing cell clusters.
Figure EV1
Figure EV1. Assessment of transgenic lineage tracer mouse line and AAV kinetics in vivo.
(A) Schematic of tamoxifen-inducible transgenic mouse line for MG-specific expression, (B) bar plot of min to max quantification of recombination efficiency counted as percentage ratio of RFP+Sox2+ cells over all Sox2+ where each dot is a biological replicate (error bar: mean plus standard deviation), (CC”) fluorescence images of Rlbp1-CreERt2 x LSL-TdT retina cross-sections after tamoxifen showing DAPI-stained nuclei in white, TdT in red and HuC/D in cyan, (DD”) fluorescence images of Rlbp1-CreERt2 x LSL-TdT retina cross-sections after tamoxifen showing DAPI-stained nuclei in white, TdT in red, Otx2 in blue and EdU in yellow, (E) fluorescence image of an untreated retina flatmount with TdT in red and vasculature in white, (E’) representative retina cross-section of untreated retina with TdT in red and Sox2 in yellow (F) schematic of experimental design, (G) fluorescence images of retina flatmounts for each timepoint with TdT in red and vasculature in white, (G’) representative retina cross-sections from timepoints in (G) with DAPI-stained nuclei in white, TdT in red and Sox2 in yellow; scalebars for (CC”, DD”, G’, E’): 50 μm, for (E, G): 500 μm, ONL outer nuclear layer, INL inner nuclear layer, GCL ganglion cell layer.
Figure EV2
Figure EV2. Control experiments to assess Cre-dependent vector expression.
(A) Schematic of transgenic lineage tracer without tamoxifen administration and the FLEX vectors administered to assess traces of DNA recombination during AAV production, (A’) fluorescence images of stained tissue post CBh-FLEX[GFP] and CBh-FLEX[Ascl1-GFP] injection, with white arrows indicating cells where vector or lineage tracer recombination occurs without tamoxifen in MG cells that are not Otx2 or HuC/D positive.
Figure EV3
Figure EV3. AAV transduction and validation of protein markers.
(A) Fluorescence images of Rlbp1-CreERt2 x LSL-TdT central retina cross-sections showing AAV-transduced cells in green, TdT in red and EdU proliferating cells in cyan for control and reprogramming vector conditions, (B) fluorescence images after reprogramming with ht AAV/CBh-FLEX[Ascl1], top row: transduced cells (white arrowhead) co-labeled with Ascl1 in white, GFP in green and TdT in red; bottom panel: transduced cells (white arrowhead) co-labeled with EdU in cyan, GFP in green and TdT in red, (C) fluorescence images after reprogramming with AAV/CBh-FLEX[Ascl1] showing transduced cells (white arrowhead) co-labeled with Otx2 in cyan, GFP in green and TdT in red; scale bar for (A): 200 μm, (B, C): 20 μm.
Figure EV4
Figure EV4. Transcriptional analysis of AAV-mediated reprogramming.
(AC) Fluorescence images of sorted lineage-traced cells on coverslips 24 h post FACS split by condition (white arrows indicate reprogrammed cells) showing merged and single channels of DAPI in blue, GFP vector reporter in green, TdT lineage tracer in red and glial marker Sox2 or bipolar marker Otx2 in white, (D) heatmap of average gene expression for selected neuronal genes in clusters NPre and MG-derived neurons following AAV-mediated reprogramming, (E) fluorescence images of retinal cross-section with proliferating lineage-traced MG (white arrows) and microglia (yellow arrows) with TdT in red, Iba1 in cyan and EdU in white, (F) UMAP of consolidated scRNA-seq data of Ascl1-mediated neurogenesis from transgenic animals (Glast-CreERt2 x LSL-tTA x tetO-Ascl1-GFP), (G) heatmap of top 40 differentially expressed genes across pseudotime trajectory from glial cell fate to neuronal cell fate based on scRNA-seq data from (F); scale bar: 50 μm, ONL outer nuclear layer, INL inner nuclear layer, GCL ganglion cell layer.
Figure EV5
Figure EV5. AAV-borne Ascl1-Atoh1/7 expression induces neurogenesis that phenocopies transgenics.
(A, A’) Fluorescence images of reprogrammed cells (white arrows) per condition showing merged and single channels of DAPI in white, TdT in red and Otx2 in cyan, (B) bar plot of MG reprogramming to distinct neuronal fates (HuC/D or Otx2) after AAV-mediated Ascl1-Atoh1 or Ascl1-Atoh7 expression counted as a percentage ratio of neuron+TdT+ over all TdT+ cells with each dot being a biological replicate, (C) bar plot of the percentrage that each vector treatment contributed to the formation of reprogrammed clusters NPre and MG-derived AC/RGC-like neurons where each column represents a color-coded sample. (D) Bar plot of Edu incorporation counted as a ratio of neuron+EdU+ over all EdU+ cells with each dot being a biological replicate, (E) heatmap of top 40 differentially expressed genes across pseudotime trajectory from glial cell fate to neuronal cell fate based on scRNA-seq data from transgenic experiments, followed by heatmap of gene expression in scRNA-seq data from AAV experiments that follows the genelist generated from consolidated transgenic data for Ascl1-Atoh1/7 reprogramming; error bars for bar plots:mean plus standard deviation, statistical significance based on ordinary one-way ANOVA with Tukey’s multiple comparisons test (significance P < 0.05, * = 0.05, ** = 0.01, *** = 0.001, **** = 0.0001, no significance detected); scale bar for (AA’): 20 μm.

References

    1. Bainbridge JWB, Smith AJ, Barker SS, Robbie S, Henderson R, Balaggan K, Viswanathan A, Holder GE, Stockman A, Tyler N et al (2008) Effect of gene therapy on visual function in Leber’s congenital amaurosis. New Engl J Med 358:2231–2239 - PubMed
    1. Bainbridge JWB, Mehat MS, Sundaram V, Robbie SJ, Barker SE, Ripamonti C, Georgiadis A, Mowat FM, Beattie SG, Gardner PJ et al (2015) Long-term effect of gene therapy on Leber’s congenital amaurosis. New Engl J Med 372:1887–1897 - PMC - PubMed
    1. Blackshaw S, Sanes JR (2021) Turning lead into gold: reprogramming retinal cells to cure blindness. J Clin Investig 131:e146134 - PMC - PubMed
    1. Chen YC, Ma NX, Pei ZF, Wu Z, Do-Monte FH, Keefe S, Yellin E, Chen MS, Yin JC, Lee G et al (2020) A NeuroD1 AAV-based gene therapy for functional brain repair after ischemic injury through in vivo astrocyte-to-neuron conversion. Mol Ther 28:217–234 - PMC - PubMed
    1. Clark BS, Stein-O’Brien GL, Shiau F, Cannon GH, Davis-Marcisak E, Sherman T, Santiago CP, Hoang TV, Rajaii F, James-Esposito RE et al (2019) Single-cell RNA-seq analysis of retinal development identifies NFI factors as regulating mitotic exit and late-born cell specification. Neuron 102:1111–1126.e5 - PMC - PubMed

Substances

LinkOut - more resources