Epigenome-wide analysis reveals potential biomarkers for radiation-induced toxicity risk in prostate cancer
- PMID: 40050897
- PMCID: PMC11887099
- DOI: 10.1186/s13148-025-01846-8
Epigenome-wide analysis reveals potential biomarkers for radiation-induced toxicity risk in prostate cancer
Abstract
Background: Prostate cancer is the second most common cancer globally, with radiation therapy (RT) being a key treatment for clinically localized and locally advanced cases. Given high survival rates, addressing long-term side effects of RT is crucial for preserving quality-of-life. Radiogenomics, the study of genetic variations affecting response to radiation, has primarily focussed on genomic biomarkers, while DNA methylation studies offer insights into RT responses. Although most research has centred on tumours, no epigenome-wide association studies have explored peripheral blood biomarkers of RT-induced toxicities in prostate cancer patients. Identifying such biomarkers could reveal molecular mechanisms underlying RT response and enable personalized treatment.
Methods: We analysed 105 prostate cancer patients (52 cases and 53 controls). Cases developed grade ≥ 2 genitourinary and/or gastrointestinal late toxicity after 12 months of starting RT, whereas controls did not. An epigenome-wide association study of post-RT toxicities was performed using the Illumina MethylationEPIC BeadChip, adjusting for age and cell type composition. We constructed two methylation risk scores-one using differentially methylated positions (MRSsites) and another using differentially methylated regions (MRSregions)-as well as a Support Vector Machine-based methylation signature (SVMsites). We evaluated RT effects on biological age and stochastic epigenetic mutations within established radiation response pathways. Gene Ontology and pathway enrichment analyses were also performed.
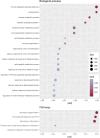
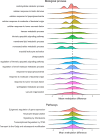
Results: Pre-RT methylation analysis identified 56 differentially methylated positions (adjusted p-value ≤ 0.05), and 6 differentially methylated regions (p-value ≤ 0.05) associated with the genes NTM, ACAP1, IL1RL2, VOOP1, AKR1E2, and an intergenic region on chromosome 13 related to Short/Long Interspersed Nuclear Elements. Both Methylation Risk Scores (MRSsites AUC = 0.87; MRSregions AUC = 0.89) and the 8-CpG Support Vector Machine signature (SVMsites AUC = 0.98) exhibited strong discriminatory accuracy in classifying patients in the discovery cohort. Gene ontology analysis revealed significant enrichment (adjusted p-value ≤ 0.05) of genes involved in DNA repair, inflammatory response, tissue repair, and oxidative stress response pathways.
Conclusions: Epigenetic biomarkers show potential for predicting severe long-term adverse effects of RT in prostate cancer patients. The identified methylation patterns provide valuable insights into toxicity mechanisms and may aid personalized treatment strategies. However, validation in independent cohorts is essential to confirm their predictive value and clinical applicability.
Keywords: Adverse Effects; Cancer; EWAS; Epigenetic biomarkers; Prostate; Radiogenomics; Radiotherapy; Stratify Patients for Treatments; Therapy Response.
© 2025. The Author(s).
Conflict of interest statement
Declarations. Ethics approval and consent to participate: Informed written consent was secured from each participant, and the protocol was approved by the ethics review board of the Comité de Ética de la Investigación de Santiago-Lugo (Ref: 2021/141). Consent for publication: Not applicable. Competing interests: The authors declare no competing interests.
Figures


Similar articles
-
Epigenome-Wide Tumor DNA Methylation Profiling Identifies Novel Prognostic Biomarkers of Metastatic-Lethal Progression in Men Diagnosed with Clinically Localized Prostate Cancer.Clin Cancer Res. 2017 Jan 1;23(1):311-319. doi: 10.1158/1078-0432.CCR-16-0549. Epub 2016 Jun 29. Clin Cancer Res. 2017. PMID: 27358489 Free PMC article.
-
Epigenome-Wide Association Study of Prostate Cancer in African Americans Identifies DNA Methylation Biomarkers for Aggressive Disease.Biomolecules. 2021 Dec 3;11(12):1826. doi: 10.3390/biom11121826. Biomolecules. 2021. PMID: 34944472 Free PMC article.
-
Epigenome-wide DNA methylation and transcriptome profiling of localized and locally advanced prostate cancer: Uncovering new molecular markers.Genomics. 2022 Sep;114(5):110474. doi: 10.1016/j.ygeno.2022.110474. Epub 2022 Aug 31. Genomics. 2022. PMID: 36057424
-
Epigenome-wide DNA methylation and risk of breast cancer: a systematic review.BMC Cancer. 2020 Oct 31;20(1):1048. doi: 10.1186/s12885-020-07543-4. BMC Cancer. 2020. PMID: 33129307 Free PMC article.
-
Functional outcomes and complications following radiation therapy for prostate cancer: a critical analysis of the literature.Eur Urol. 2012 Jan;61(1):112-27. doi: 10.1016/j.eururo.2011.09.027. Epub 2011 Oct 6. Eur Urol. 2012. PMID: 22001105 Review.
References
-
- Ferlay J, Colombet M, Soerjomataram I, Mathers C, Parkin DM, Piñeros M, et al. Global Cancer Observatory: Cancer Today. Lyon, France: International Agency for Research on Cancer. Int J Cancer. 2018. 10.1002/ijc.31937. - PubMed
-
- Schaeffer EM, Srinivas S, Adra N, An Y, Barocas D, Bitting R, et al. NCCN Guidelines Version 4. 2023 Prostate Cancer. 2023. https://www.nccn.org/home/. Accessed 01 May 2024.
-
- Hamdy FC, Donovan JL, Lane JA, Metcalfe C, Davis M, Turner EL, et al. Fifteen-year outcomes after monitoring, surgery, or radiotherapy for prostate cancer. N Engl J Med. 2023. 10.1056/nejmoa2214122. - PubMed
-
- Andreassen CN, Alsner J, Overgaard J. Does variability in normal tissue reactions after radiotherapy have a genetic basis - Where and how to look for it? Radiother Oncol. 2002. 10.1016/S0167-8140(02)00154-8. - PubMed
MeSH terms
Substances
Grants and funding
- PI22/00589/Spanish Instituto de Salud Carlos III (ISCIII) funding, an initiative of the Spanish Ministry of Economy and Innovation partially supported by European Regional Development FEDER Funds
- IN607B/Autonomous Government of Galicia (Consolidation and structuring program)
- PRYES211091VEGA/Fundación Científica Asociación Española Contra el Cáncer
LinkOut - more resources
Full Text Sources
Medical

