. 2025 Dec;20(1):2475276.
doi: 10.1080/15592294.2025.2475276. Epub 2025 Mar 6.

Placental malaria induces a unique methylation profile associated with fetal growth restriction

Affiliations

Placental malaria induces a unique methylation profile associated with fetal growth restriction

Nida Ozarslan et al. Epigenetics. 2025 Dec.

Abstract

Fetal growth restriction (FGR) is associated with perinatal death and adverse birth outcomes, as well as long-term complications, including increased childhood morbidity, abnormal neurodevelopment, and cardio-metabolic diseases in adulthood. Placental epigenetic reprogramming associated with FGR may mediate these long-term outcomes. Placental malaria (PM), characterized by sequestration of Plasmodium falciparum-infected erythrocytes in placental intervillous space, is the leading global cause of FGR, but its impact on placental epigenetics is unknown. We hypothesized that placental methylomic profiling would reveal common and distinct mechanistic pathways of non-malarial and PM-associated FGR. We analyzed placentas from a US cohort with no malaria exposure (n = 12) and a cohort from eastern Uganda, a region with a high prevalence of malaria (n = 12). From each site, 8 cases of FGR and 4 healthy controls were analyzed. PM was diagnosed by placental histopathology. We compared the methylation levels of over 850K CpGs of the placentas using Infinium MethylationEPIC v1 microarray. Non-malarial FGR was associated with 65 differentially methylated CpGs (DMCs), whereas PM-FGR was associated with 133 DMCs, compared to their corresponding controls without FGR. One DMC (cg16389901, located in the promoter region of BMP4) was commonly hypomethylated in both groups. We identified 522 DMCs between non-malarial FGR vs. PM-FGR placentas, independent of differing geographic location or cellular composition. Placentas with PM-associated FGR have distinct methylation profiles compared to placentas with non-malarial FGR, suggesting novel epigenetic reprogramming in response to malaria. Larger cohort studies are needed to determine the distinct long-term health outcomes in PM-associated FGR pregnancies.

Keywords: IUGR; Pregnancy; epigenetics; fetal growth restriction; fetal programming; malaria; placenta; plasmodium falciparum.


Conflict of interest statement

No potential conflict of interest was reported by the author(s).

Figures
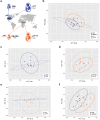
Figure 1.
Figure 1.
Principal component analysis. a. Schematic demonstration of study groups and collection sites. b. Principal component analysis including all samples. c. Principal component analysis of FGR and CFGR samples. d. Principal component analysis of PM-FGR and CPM-FGR samples e. Principal component analysis of CFGR and CPM-FGR samples f. Principal component analysis of FGR and PM-FGR samples.
Figure 2.
Figure 2.
Differentially methylated CpGs (DMCs) observed with non-malarial FGR and placental malaria-associated FGR, and their respective controls. a. Manhattan plot of 65 DMCs (p < 0.0001 and |Δβ| > 0.1) between FGR vs. CFGR demonstrated by pink circles. b. Volcano plot displaying 48 hypomethylated and 17 were hypermethylated CpGs with FGR vs. CFGR indicated by pink circles. c. Bar graph demonstrating the distribution of hypermethylated (dark pink) and hypomethylated (light pink) DMCs with FGR vs. CFGR among CpG positions. d. Manhattan plot of 133 DMCs (p < 0.0001 and |Δβ| > 0.1) between PM-FGR vs. CPM-FGR demonstrated by teal circles. e. Volcano plot displaying 82 hypomethylated and 51 were hypermethylated CpGs with PM- FGR vs. CPM-FGR indicated by teal circles. f. Bar graph demonstrating the distribution of hypermethylated (dark teal) and hypomethylated (light teal) DMCs with PM- FGR vs. CPM-FGR among CpG positions.
Figure 3.
Figure 3.
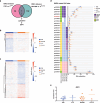
Commonly differentially methylated CpG site with non-malarial FGR and placental malaria-associated FGR. a. Venn diagram demonstrating the sole overlapping differentially methylated CpG site, cg16389901, that was commonly hypomethylated with both non-malarial and placental malaria- associated FGR when compared to their controls. b. Normalized methylation levels of all samples based on their geographically matched control group average of 65 DMCs identified between FGR vs. CFGR c. Normalized methylation levels of all samples based on their geographically matched control group average of 133 DMCs identified between PM-FGR vs. CPM-FGR d. Average DNA methylation of CpG sites associated with BMP4, including cg16389901 (marked in red), for all four groups. Red asterisk indicates significance. E. Gene expression levels of BMP4 measured by qRT-pcr.
Figure 4.
Figure 4.
Differentially methylated CpGs (DMCs) observed between non-malarial FGR vs. placental malaria-associated FGR. a. Venn diagram demonstrating the 522 DMCs (p < 0.0001 and |Δβ| > 0.1) between FGR vs. PM-FGR after subtracting geographical location-driven baseline differences b. Manhattan plot of 522 DMCs between FGR vs. PM-FGR demonstrated by purple circles. c. Volcano plot displaying 143 hypermethylated CpGs in FGR and 379 CpGs hypermethylated in PM-FGR indicated by purple circles. d. Bar graph demonstrating the distribution of hypermethylated CpGs with FGR (light purple) and hypermethylated with PM-FGR (dark purple) among CpG positions.
Figure 5.
Figure 5.
Cellular deconvolution analysis based on overall methylation levels. a. Cell composition of all samples estimated using robust partial correlations analysis through planet package in R. b. Hierarchical clustering of all samples based on cellular deconvolution results. c. Hierarchical clustering of FGR and PM-FGR samples based on cellular deconvolution analysis. d. Venn diagram demonstrating the overlap between CpGs used for cellular deconvolution analysis and differentially methylated CpGs between FGR vs. PM-FGR.

Update of

Similar articles

References

    1. Garrison A, Boivin MJ, Fiévet N, et al. The effects of malaria in pregnancy on neurocognitive development in children at 1 and 6 years of age in Benin: a prospective mother–child cohort. Clin Infect Dis Off Publ Infect Dis Soc Am. 2022. Mar 9;74(5):766–16. doi: 10.1093/cid/ciab569 - DOI - PMC - PubMed
    1. Bangirana P, Conroy AL, Opoka RO, et al. Effect of malaria and malaria chemoprevention regimens in pregnancy and childhood on neurodevelopmental and behavioral outcomes in children at 12, 24, and 36 months: a randomized clinical trial. Clin Infect Dis. 2023. Feb 18;76(4):600–608. doi: 10.1093/cid/ciac815 - DOI - PMC - PubMed
    1. Conroy AL, Bangirana P, Muhindo MK, et al. Case report: birth outcome and neurodevelopment in placental malaria discordant twins. Am J Trop Med Hyg. 2019. Mar;100(3):552–555. doi: 10.4269/ajtmh.18-0659 - DOI - PMC - PubMed
    1. Bangirana P, Opoka RO, Boivin MJ, et al. Severe malarial anemia is associated with long-term neurocognitive impairment. Clin Infect Dis. 2014. Aug 1;59(3):336–344. doi: 10.1093/cid/ciu293 - DOI - PMC - PubMed
    1. Moore KA, Simpson JA, Wiladphaingern J, et al. Influence of the number and timing of malaria episodes during pregnancy on prematurity and small-for-gestational-age in an area of low transmission. BMC Med. 2017. Dec;15(1):117. doi: 10.1186/s12916-017-0877-6 - DOI - PMC - PubMed