. 2025 May;12(17):e2407426.
doi: 10.1002/advs.202407426. Epub 2025 Mar 7.

Chromatin Organization Governs Transcriptional Response and Plasticity of Cancer Stem Cells

Affiliations

Chromatin Organization Governs Transcriptional Response and Plasticity of Cancer Stem Cells

Yinu Wang et al. Adv Sci (Weinh). 2025 May.

Abstract

Chromatin organization regulates transcription to influence cellular plasticity and cell fate. We explored whether chromatin nanoscale packing domains are involved in stemness and response to chemotherapy. Using an optical spectroscopic nanosensing technology we show that ovarian cancer-derived cancer stem cells (CSCs) display upregulation of nanoscale chromatin packing domains compared to non-CSCs. Cleavage under targets and tagmentation (CUT&Tag) sequencing with antibodies for repressive H3K27me3 and active H3K4me3 and H3K27ac marks mapped chromatin regions associated with differentially expressed genes. More poised genes marked by both H3K4me3 and H3K27me3 were identified in CSCs vs. non-CSCs, supporting increased transcriptional plasticity of CSCs. Pathways related to Wnt signaling and cytokine-cytokine receptor interaction were repressed in non-CSCs, while retinol metabolism and antioxidant response were activated in CSCs. Comparative transcriptomic analyses showed higher intercellular transcriptional heterogeneity at baseline in CSCs. In response to cisplatin, genes with low baseline expression levels underwent the highest upregulation in CSCs, demonstrating transcriptional plasticity under stress. Epigenome targeting drugs downregulated chromatin packing domains and promoted cellular differentiation. A disruptor of telomeric silencing 1-like (Dot1L) inhibitor blocked transcriptional plasticity, reversing stemness. These findings support that CSCs harbor upregulated chromatin packing domains, contributing to transcriptional and cell plasticity that epigenome modifiers can target.

Keywords: cancer stem cells; cell plasticity; chromatin organization; ovarian cancer; transcriptional heterogeneity.


Conflict of interest statement

The authors declare no conflict of interest.

Figures

Figure 1
Figure 1
ALDH+ CSCs express stemness pathways and harbor aberrant chromatin organization. A) Volcano plot of differentially expressed genes (DEGs) that compares ALDH+ CSCs derived from OVCAR5 cells with ALDH− non‐CSCs. Genes with a p‐value of at most 10−6 and a log fold change of at least 2 are shown in red, while genes with expression changes above the same log fold change threshold and p‐values larger than 10−6 are shown in green. Nondifferentially expressed genes (low log fold change and large p‐value) are depicted in gray. B) Gene set enrichment analysis performed using gene ontology (GO) biological process (BP) terms on OVCAR5‐derived ALDH+ CSCs versus ALDH− non‐CSCs. C) −log10 (p‐value) for the top seven most enriched GO BP terms. Enrichment analysis was performed using the list of DEGs with an adjusted p‐value < 0.1. D) Circular network plot of the top five enriched GO BP terms. The sizes of the five nodes corresponding to each BP term are based on the number of DEGs in each term. The colors of each gene node depict the fold change, with red indicating more expression in ALDH+ cells while blue denotes higher expression in ALDH− cells. The colors of the lines connecting the BP term nodes to the gene nodes are based on the term the gene is associated with. E) GSEA for the gene sets BOQUEST_STEM_CELL_UP and LIM_MAMMARY_STEM_CELL_UP shows upregulation in OVCAR5 CSCs versus non‐CSCs (FDR = 0). F,G) Partial wave spectroscopic (PWS) microscopy detects chromatin architecture of CSCs and non‐CSCs derived from OC cells. Representative images display nuclear signals in ALDH+ and ALDH− cells derived from (F) OVCAR5 and (G) OVCAR3. Brighter red indicates higher Dn (scale bar: 5 µm). The violin plots show the distribution of Dn values in the cell population with each individual nucleus shown as a white dot within the violin. Data were collected across three replicates. ALDH+ cells in both cell lines have higher Dn compared to ALDH− cells (p < 0.05).
Figure 2
Figure 2
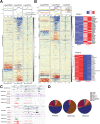
Epigenetic marks mapping in CSCs versus non‐CSCs. A) Heatmaps and metaplots for the log2 fold change of the H3K27ac, H3K4me3, and H3K27me3 ChIP‐seq in OVCAR5_ALDH+ CSCs compared to OVCAR5_ALDH− non‐CSCs (n = 2). Promoters for all significantly differentially expressed genes are shown, either upregulated in ALDH+ versus ALDH− (blue line) or downregulated in ALDH+ versus ALDH− (green line), as identified in the RNA sequencing (RNA‐seq) analysis. Promoters are hierarchically clustered according to H3K27ac, H3K4me3, and H3K27me3 occupancy. B) The same promoter regions shown in (A) are now K‐means clustered (K = 6) according to their log2 fold change of the H3K27ac, H3K4me3, and H3K27me3 ChIP‐seq in OVCAR5‐derived ALDH+ CSCs compared to ALDH− non‐CSCs (n = 2). The average signal for each of these epigenetic marks is shown for all 6 clusters in the metaplots above the heatmaps. Two particularly striking clusters (clusters 1 and 5) are highlighted to the right and accompanied by the RNA‐seq data from the associated genes. C) Representative tracks for H3K27ac, H3K4me3, and H3K27me3 enrichment at the ALDH1A3 locus in “cluster 1,″, and nerve growth factor receptor (NGFR) in “cluster 5.″ Both ChIP‐seq and RNA‐seq tracks are included. D) Genome‐wide distribution of all differentially bound peaks for H3K27ac, H3K4me3, and H3K27me3 in ALDH+ versus ALDH− cells (p < 0.05, n = 2).
Figure 3
Figure 3
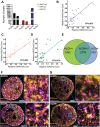
CSCs increase levels of poised heterochromatin cores. A) The total number of differentially bound H3K27ac, H3K4me3, and H3K27me3 peaks in OVCAR5‐derived ALDH+ versus ALDH− cells (p < 0.05, n = 2). B–D) The correlation between the per‐chromosomal density of (B) H3K27me3 and H3K4me3 (R 2 = 0.675), (C) H3K27ac and H3K4me3 (R 2 = 0.663), (D) H3K27me3 and H3K27ac (R 2 = 0.474). Overall, heterochromatin correlates with euchromatin markers on a per‐chromosome basis. E) To identify poised genes, all called peaks within 2 kb of a TSS were associated with that gene. Genes associated with both H3K4me3 and H3K27me3 are considered “poised” and their numbers in ALDH+ and ALDH− cells are shown. Shared poised genes are included in the overlapping area. F) The spatial distribution of active H3K27ac (yellow) and repressive H3K27me3 (pink), and G) active H3K4me3 (yellow) and H3K27me3 (pink) visualized using stochastic optical reconstruction microscopy (STORM) in ALDH+ and ALDH− cells. Scale bars: 3 µm.
Figure 4
Figure 4
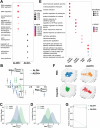
CSCs display greater transcriptional plasticity compared to non‐CSCs. A) GO enrichment analysis indicates the top five biological processes among DEGs (p < 0.05) identified through bulk RNA‐seq analysis from flow‐sorted ALDH+ CSCs or ALDH− non‐CSCs treated with cisplatin (1 µm for 24 h) versus control dimethyl sulfoxide (DMSO). B) Change in gene expression as a function of the initial gene expression level. Genes were grouped into quantiles based on the expression level in control (DMSO)‐treated cells. The average expression for control is plotted on the x‐axis, while the change in expression after treatment with cisplatin is plotted on the y‐axis. Error bars are standard errors of the mean. C,D) Probability distribution functions (PDFs) generated using kernel density estimation (KDE) of the differential expression induced by cisplatin on genes within the DMSO‐treated (control) cells that are underexpressed (C) by ALDH− and those that are underexpressed (D) by ALDH+. E) GO enrichment analysis indicates the top five pathways activated in CSCs versus non‐CSCs at baseline and in response to cisplatin treatment (1 µm, 24 h) based on single cell RNA sequencing (scRNA‐seq) analysis. The differential expression was calculated using pseudobulk values. F) Intercellular transcriptional heterogeneity of control and cisplatin‐treated CSCs versus non‐CSCs. A 3D t‐SNE (stochastic neighbor embedding) dimension reduction was performed on PCA dimensions 1–20 for each condition. Each point represents a cell. G) The radius of genomic space is calculated from the t‐SNE plots in (F) by determining the radius of the circle within which all the cells can be contained.
Figure 5
Figure 5
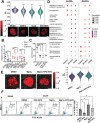
Epigenetic inhibitors reduce chromatin packing domains in CSCs and promote cell differentiation. A) Representative images of chromatin packing domains visualized by PWS microscopy in OVCAR5‐derived ALDH+ CSCs treated with vehicle (DMSO, 0.1%), guadecitabine (100 nm) EZH2i (GSK126, 2 mm), and Dot1Li (EPZ‐5676, 100 nm) for 5 days. The average nuclear Dn is shown below (all scale bars: 5 µm). B) mRNA expression levels of stemness‐associated TFs SOX2, OCT4, and stemness gene ALDH1A1 measured by quantitative reverse transcriptase‐polymerase chain reaction (qRT‐PCR) (n = 3–4) in OVCAR5‐derived ALDH+ cells treated as in (A). C) Spheroid formation of OVCAR5‐derived ALDH+ CSCs treated with epigenome targeting agents described in (A). Mean values of 3 biological replicates ± standard deviation (SD) are calculated (*p < 0.05; **p < 0.01; ***p < 0.001). D) GO enrichment analysis of the top pathways activated in CSCs and non‐CSCs in response to cisplatin (1 µm, 24 h) alone, Dot1Li (1 µm, 72 h) alone, or priming Dot1Li (1 µm, 72 h) with cisplatin treatment (1 µm, 24 h) compared with DMSO‐treated cells. Transcription was measured by bulk RNA‐seq (n = 2 replicates). E) Representative images of chromatin packing domains visualized by PWS microscopy in COV362 cells treated with vehicle (DMSO, 0.1%), MgCl2 (5 mm), or MgCl2+Dot1Li (EPZ‐5676, 1 µm) for 5 days. The average nuclear Dn is shown (all scale bars: 5 µm). F) Side scatter images and percentages of ALDH+ cells in COV362 cells treated in (DMSO, 0.1%), Dot1Li (EPZ‐5676) (1 µm), MgCl2 (5 mm), or MgCl2+Dot1Li (EPZ‐5676) were determined by FACS (n = 3).
Figure 6
Figure 6
Inhibition of Dot1L reduces OCSC population and stemness gene expression. A) (Left) Western blot analysis of H3K79Me3, H3K79Me2, and H3 (loading control) protein levels in OVCAR5 cells treated with DOT1Li EPZ‐5676 (100 nm, or 1 µm) or DMSO for 5 days. (Right) Quantification is shown (n = 3 replicates). B) OVCAR5 cells in a serial dilution (10, 25, 50, 100, 250, 500, 1000, 2000 cells per well) were treated with DMSO or 100 nm Dot1Li for 7 days (n = 12). CSC frequency was calculated by using the ELDA software. C) Percentages of ALDH+ cells determined by FACS in OVCAR5 cells treated with 1 mm DOT1Li (n = 3). D) mRNA expression levels of SOX2NANOG, and ALDH1A1 in OVCAR5 cells treated with DMSO or DOT1Li (1 µm) for 5 days. Data are shown as means ± SD of 3 biological replicates. E) FACS analysis of the percentages of ALDH+ cells among cell populations derived from human HGSOC tumors and treated with DMSO or DOT1Li (1, 5 µm, 5 days, n = 3 biological replicates). F) Quantification of spheroids derived from 1000 cells from human tumor‐derived single‐cell suspensions treated with DMSO or DOT1Li (1 µm) for 5 days, as measured by the CellTiter Glo 3D assay (n = 6 tumor specimens). G) Serially diluted DMSO‐ or DOT1Li (1 µm, 5 days)‐treated OVCAR5 cells (500, 1000, and 2500) were injected subcutaneous (SQ) into nude mice to measure tumor initiation and tumor growth. Mice were euthanized and tumors were harvested on day 30 after cell injection. (Left) Log‐fraction plot shows tumor initiation in mice injected with DMSO‐ or DOT1Li (1 µm)‐treated OVCAR5 cells (n = 3 per group). (Right) CSC frequencies in the tumors derived from DMSO‐ or DOT1Li (1 µm)‐treated OVCAR5 cells were determined by the ELDA software (http://bioinf.wehi.edu.au/software/elda/) and shown in a bar graph. H) Means ± SD of tumor weights from mice injected with OVCAR5 OC cells treated with DMSO or DOT1Li (1 µm) (n = 6 mice per group). Data are shown as means ± SD of replicates, n = 5–6 (*p < 0.05; **p < 0.01; ***p < 0.005; and ****p < 0.001).

References

    1. Bjerkvig R., Tysnes B. B., Aboody K. S., Najbauer J., Terzis A. J. A., Nat. Rev. Cancer 2005, 5, 995. - PubMed
    1. Jordan C. T., Guzman M. L., Noble M., N. Engl. J. Med. 2006, 355, 1253. - PubMed
    1. Pattabiraman D. R., Weinberg R. A., Nat. Rev. Drug Discovery 2014, 13, 497. - PMC - PubMed
    1. Li Y., Eshein A., Virk R. K. A., Eid A., Wu W., Frederick J., VanDerway D., Gladstein S., Huang K., Shim A. R., Anthony N. M., Bauer G. M., Zhou X., Agrawal V., Pujadas E. M., Jain S., Esteve G., Chandler J. E., Nguyen T.‐Q., Bleher R., de Pablo J. J., Szleifer I., Dravid V. P., Almassalha L. M., Backman V., Sci. Adv. 2021, 7, abe4310. - PMC - PubMed
    1. Virk R. K. A., Wu W., Almassalha L. M., Bauer G. M., Li Y., VanDerway D., Frederick J., Zhang D.i, Eshein A., Roy H. K., Szleifer I., Backman V., Sci. Adv. 2020, 6, eaax6232. - PMC - PubMed

LinkOut - more resources