. 2025 Feb 20:16:1499397.
doi: 10.3389/fimmu.2025.1499397. eCollection 2025.

Modeling human natural killer cell development and drug response in a microfluidic bone marrow model

Affiliations

Modeling human natural killer cell development and drug response in a microfluidic bone marrow model

Leopold Koenig et al. Front Immunol. .

Abstract

Introduction: The human bone marrow is a complex organ that is critical for self-renewal and differentiation of hematopoietic progenitor cells into various lineages of blood cells. Perturbations of the hematopoietic system have been reported to cause numerous diseases. Yet, understanding the fundamental biology of the human bone marrow in health and disease and during the preclinical stages of drug development is challenging due to the complexity of studying or manipulating the human bone marrow. Human cell-based microfluidic bone marrow models are promising research tools to explore multi-lineage differentiation of human stem and progenitor cells over long periods of time.

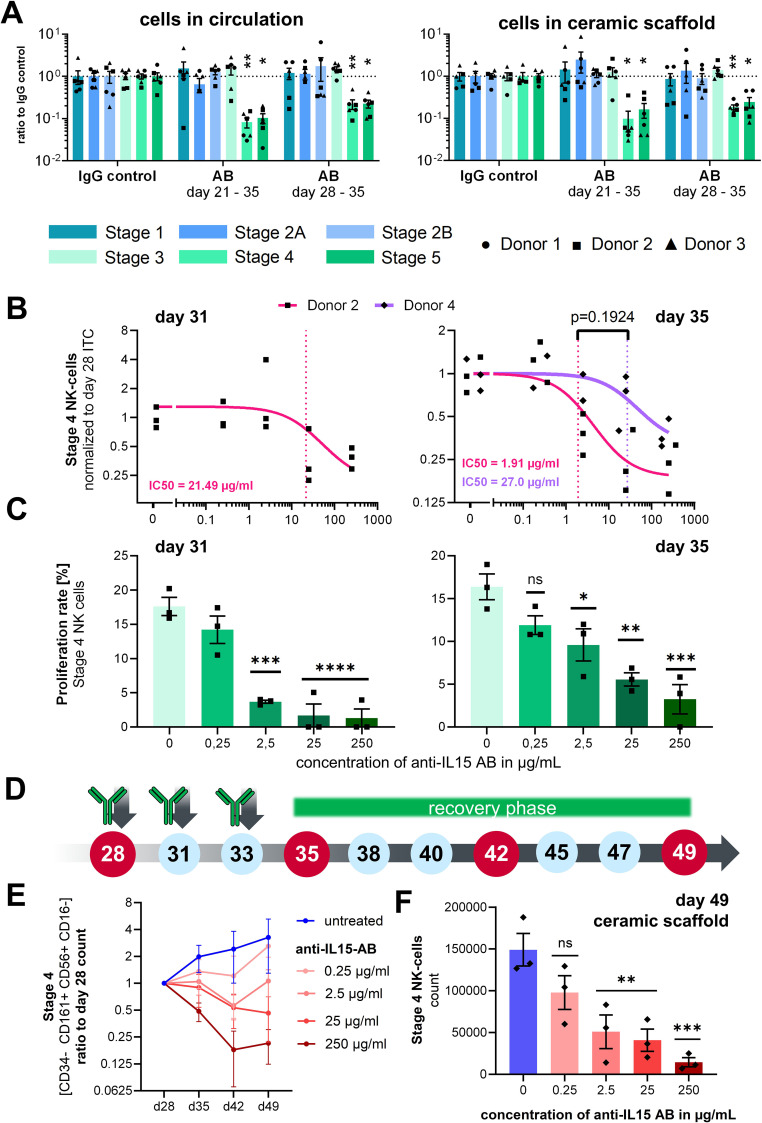
Methods: Human hematopoietic stem and progenitor cells were cultured with mesenchymal stromal cells on a zirconium oxide ceramic scaffold in a microfluidic device recapitulating the human bone marrow. NK cell differentiation was induced by the application of a lymphoid cultivation medium containing IL-15. The kinetics of differentiation into mature NK cells was traced by flow cytometry over a period of up to seven weeks, and functionality was measured by stimulation with phorbol myristate acetate (PMA) and ionomycin. The effect of an anti-IL-15 monoclonal antibody (TEV-53408) on different NK cell subtypes was tested at different time points.

Results: Our data shows that within 28 days of culture, differentiation into all developmental stages of NK cells was accomplished in this system. Alongside with the NK cells, myeloid cells developed in the system including granulocytes, monocytes and dendritic cells. The differentiated NK cells could be activated after stimulation with PMA and ionomycin indicating the functionality of the cells. Treatment with an anti-IL-15 antibody induced a reduction in proliferation of late-stage NK cells as shown by EdU staining. This led to significantly dose dependent reduction in the number of circulating stage 4 - 6 NK cells in the system after one week of treatment. This effect was partially reversible after a two-week treatment-free period.

Discussion: In summary, the presented model enables investigation of human NK cell development in the bone marrow and provides a basis to study related diseases and drug response effects in a microenvironment that is designed mimic human physiology.

Keywords: NK cell; bone marrow; drug response; immunotoxicity; organ-on-a-chip.


Conflict of interest statement

Authors LK, TT, and AW are employees of the company TissUse GmbH. Authors IB-E and MG are employees of the company Teva Pharmaceutical Industries Ltd. TissUse Gmbh was funded by Teva to conduct the described research. Both TissUse Gmbh and Teva were involved in the research studies and the writing of this publication. The authors declare that this study received funding from Teva Pharmaceutical Industries, Ltd. The funder had the following involvement in the study: design, data analysis and interpretation, and the writing of the manuscript.

Figures

Figure 1
Figure 1
Setup of the NK cell bone marrow model in the HUMIMIC Chip2. (A) Exploded view of the HUMIMIC Chip2 showing the three structural layers: the polycarbonate adapter plate housing the culture compartments, the PDMS layer housing the microfluidic circulation, and the bottom glass layer closing the circulation and allowing microscopic observation. (B) 2D view of the HUMIMIC Chip2 microfluidics: the outer compartment houses the bone marrow model; the inner compartment is used as a medium compartment and as a sampling point for hematopoietic cells. (C) Progenitor populations until Stage 2B of NK cell development in CD34+ starting cell pool from three donors on day 0. (D) Exemplary microscopic images of a medium compartment on day 7 with 35% confluency and on day 21 with 100% confluency, scale is 1mm. (E) Time schedule of the NK differentiation assay in the Chip2 system with weekly sampling points for FC analysis and media exchanges every 2–3 days. (F) Used surface marker to distinguish NK cell maturation stages adapted from Abel et al. (9), Cichoki et al. (33) and Bi et al. (34). NK development goes through a stepwise differentiation starting from hematopoietic stem cells to CLP, NK cell precursors (NKP), and immature NK cells (iNK) toward mature NK cells (mNK).
Figure 2
Figure 2
Characterization of lineage differentiation in the bone marrow model. (A) Sampled cell counts of circuits over time from the circulation and harvested cell counts form the ceramic scaffold at the end of the experiment. Mean values ± SD of individual cell populations are shown as stacked bar graphs from three CD34+ donors with two chips (N = 3, n = 2). (B) Gating strategy for analysis of dendritic cells in the hematopoietic cell pool sampled on day 35 of chip culture. (C) Percentage of NK cells, granulocytes, monocyte, inflammatory DCs, myeloid/conventional DC1 and myeloid/conventional DC2 sampled at the end of the assay on day 35. Mean values ± SD of individual cell populations from three CD34+ donors (N = 3, n = 1) are shown. (D) Proliferation rate of stage 1, 2, 3, 4, and 5 NK cells in circulation on day 28 and day 35 of the assay. Mean values ± s.e.m of individual cell populations from one CD34+ donors with six chips (N = 1, n = 6) are shown. (E) Sampled cell counts of the lymphoid/NK cell lineage from the circulation over time. Mean values ± SD of individual cell populations from three experiments with in total four CD34+ donors with two to three chips (N = 4, n = 2–3) are shown.
Figure 3
Figure 3
Characterization of NK cell populations upon perturbation of culture parameters. (A) Effects of IL-15 removal from the cell culture medium between day 28 and day 35 on stage specific NK cell counts in circulation and in the ceramic scaffold relative to control circuits with continuous IL-15 supplementation. Mean values ± s.e.m of three donors (N = 3) with two chips (n = 2) are shown. Comparison of early (stages 1–3) and late (stages 4–6) NK cell counts by Welch’s t-test with Holm-Sidak correction, n(circulation) = 6, n(ceramic) = 5, *p < 0.05 and ns (p > 0.05). (B) Sampled cell counts of the lymphoid/NK cell lineage from the circulation over a time frame of 49 days. Mean values ± SD of individual cell populations are shown as stacked bar graphs from one CD34+ donor with three chips (N = 1, n = 3). (C) Exemplary FC plots of CD56 and CD16 expression in CD161+ cells in the circulation and in the ceramic scaffold, used for gating of stages 3, 4, and 5 NK cell populations on day 49 of the assay. (D) Fraction of CD16+ cells (stage 5 NK cells) of all CD161+ CD56+ NK cells at days 35 and 49 sampled from the circulation or harvested form the ceramic scaffold. Individual chips and mean ± s.e.m are shown (N = 2, n = 3). Repeated measures mixed effects model REML and Sidak multiple comparisons test, n(day 35) = 6, n(day 49) = 3, ****p < 0.0001 and *p < 0.05. (E) Exemplary FC plot of CD107a expression on stage 4 NK cells with and without PMA/ionomycin stimulation (F) Mean fluorescence intensity of CD107a-BV421 on stages 2B, 4, and 5 NK cells on day 35 with and without PMA/ionomycin stimulation. Chip-specific intensity values and geometric mean ± SD are shown from one experiment with two CD34+ donor with three chips (N = 2, n = 3). Log transformed MFI values were compared by one-way analysis of variance (ANOVA) and Tukey multiple comparisons test, n = 6, ****p < 0.0001 and *p < 0.05.
Figure 4
Figure 4
Effects of anti–IL-15 antibody TEV-53408 on stage specific NK cell counts. (A) Treatment effect on day 35 after 7 or 14 days of treatment with 250 µg/mL in the circulating cell pool and in the ceramic scaffold population. Mean values ± s.e.m. of three donors (N = 3) with two chips (n = 2) are shown. Raw cell counts were compared by a repeated measures mixed effects model REML with the Geisser-Greenhouse correction and Dunnett’s multiple comparisons test, n = 6 chips, **p < 0.01 *p < 0.05 and ns (p > 0.05). (B) Relative cell counts of stage 4 NK cells in circulation on days 31 and 35 over a concentration range of the anti–IL15-antibody from 0.25 to 250 µg/ml normalized to the stage 4 NK cells counts sampled from the same circuit on day 28. Individual circuits and mean values ± s.e.m. of two donors with three chips are shown (only one donor for day 31 analysis). Concentration response curves were calculated as a three parameters curve with a least squares regression. IC50 values were compared with an extra sum-of-squares F test. (C) Proliferation rate of stage 4 NK cells in circulation on day 31 and day 35 measured by EdU staining over a concentration range of the anti–IL-15 antibody from 0.25 ng/ml to 250 µg/ml. Mean values ± s.e.m of three chips (n = 3) from one donor are shown. Statistical comparison of means was performed by a one-way ANOVA plus Dunnett’s post hoc test with the IgG isotype condition as control condition, n = 3 chips, ****p < 0.0001, ***p < 0.001, **p < 0.01 *p < 0.05 and ns (p > 0.05). (D) Time schedule of the antibody application, cell sampling, and start of a recovery phase after day 35 of the assay. (E) Cell counts of Stage 4 NK cells in circulation sampled from untreated control circuits and circuits treated from day 28 to day 35 with different concentrations of the TEV-53408 antibody and allowed to recover following washout and medium exchange between day 35 to day 49. Measured cell counts were normalized to the cell counts in the same circuit at day 28. Mean values ± SD of three chips of one donor are shown. (F) Cell counts of Stage 4 NK cells in the ceramic scaffold sampled from untreated control circuits and circuits treated from day 28 to day 35 with different concentrations of the TEV-53408 antibody and allowed to recover following washout and medium exchange between day 35 to day 49. Mean values ± s.e.m. of three chips (n = 3) of one representative donor are shown. Statistical comparison of raw cell counts was performed by a one-way ANOVA plus Dunnett’s post hoc test with the IgG isotype condition as control condition, n = 3 chips, ***p < 0.001, **p < 0.01 *p < 0.05, and ns (p > 0.05).

References

    1. Wu Y, Tian Z, Wei H. Developmental and functional control of natural killer cells by cytokines. Front Immunol. (2017) 8:930/full. doi: 10.3389/fimmu.2017.00930/full - DOI - PMC - PubMed
    1. Björkström NK, Ljunggren HG, Michaëlsson J. Emerging insights into natural killer cells in human peripheral tissues. Nat Rev Immunol. (2016) 16:310–20. doi: 10.1038/nri.2016.34 - DOI - PubMed
    1. Simoni Y, Fehlings M, Kløverpris HN, McGovern N, Koo SL, Loh CY, et al. . Human innate lymphoid cell subsets possess tissue-type based heterogeneity in phenotype and frequency. Immunity. (2017) 46:148–61. doi: 10.1016/j.immuni.2016.11.005 - DOI - PMC - PubMed
    1. Seo S, Mace EM. Diversity of human NK cell developmental pathways defined by single-cell analyses. Curr Opin Immunol. (2022) 74:106–11. doi: 10.1016/j.coi.2021.11.001 - DOI - PMC - PubMed
    1. Lanier LL, Le AM, Civin CI, Loken MR, Phillips JH. The relationship of CD16 (Leu-11) and Leu-19 (NKH-1) antigen expression on human peripheral blood NK cells and cytotoxic T lymphocytes. J Immunol. (1986) 136:4480–6. doi: 10.4049/jimmunol.136.12.4480 - DOI - PubMed

MeSH terms

LinkOut - more resources