. 2025 Feb 20:16:1475480.
doi: 10.3389/fimmu.2025.1475480. eCollection 2025.

Single-cell analysis of CD14+CD16+ monocytes identifies a subpopulation with an enhanced migratory and inflammatory phenotype

Affiliations

Single-cell analysis of CD14+CD16+ monocytes identifies a subpopulation with an enhanced migratory and inflammatory phenotype

Vanessa Y Ruiz et al. Front Immunol. .

Abstract

Monocytes in the central nervous system (CNS) play a pivotal role in surveillance and homeostasis, and can exacerbate pathogenic processes during injury, infection, or inflammation. CD14+CD16+ monocytes exhibit diverse functions and contribute to neuroinflammatory diseases, including HIV-associated neurocognitive impairment (HIV-NCI). Analysis of human CD14+CD16+ monocytes matured in vitro by single-cell RNA sequencing identified a heterogenous population of nine clusters. Ingenuity pathway analysis of differentially expressed genes in each cluster identified increased migratory and inflammatory pathways for a group of clusters, which we termed Group 1 monocytes. Group 1 monocytes, distinguished by increased ALCAM, CD52, CD63, and SDC2, exhibited gene expression signatures implicated in CNS inflammatory diseases, produced higher levels of CXCL12, IL-1Ra, IL-6, IL-10, TNFα, and ROS, and preferentially transmigrated across a human in vitro blood-brain barrier model. Thus, Group 1 cells within the CD14+CD16+ monocyte subset are likely to be major contributors to neuroinflammatory diseases.

Keywords: BBB; CD14+CD16+ monocytes; ROS; cytokines; intermediate monocytes; scRNA-seq.


Conflict of interest statement

The authors declare that the research was conducted in the absence of any commercial or financial relationships that could be construed as a potential conflict of interest.

Figures

Figure 1
Figure 1
Analysis of CD14+CD16+ monocytes by scRNA-seq identifies nine clusters with one group of clusters exhibiting an increased migratory and inflammatory phenotype. Human CD14+ monocytes were isolated from leukopaks and cultured non-adherently with M-CSF in vitro for three days to obtain mature CD14+CD16+ monocytes, followed by cryopreservation for subsequent scRNA-seq analysis. (A) UMAP plot of 26,977 cells merged from two independent donors show nine clusters of monocytes, with each color representing a different cluster designated by number. The number of cells in each cluster are found in Supplementary Table S2 . (B) Heatmap of IPA of DEGs in each cluster compared to all other clusters, showing the level of expression of canonical and disease/functions pathways in each cluster as determined by Z-scores. Red or blue is indicative of increased and decreased pathway expression, respectively, with white denoting insufficient significant DEGs to analyze with IPA. (C) Heatmap of selected DEGs involved in migratory or inflammatory pathways, or markers of DAM, showing avg diff in expression of genes in each cluster compared to all other clusters. The color scale is based on distribution of avg diff values, with red representing positive changes, dark blue representing negative changes, and white representing insignificant changes in avg diff. (D) Violin plots showing relative expression of DEGs that encode surface proteins ALCAM, CD52, CD63, and SDC2. Each dot represents an individual cell, and each color corresponds to a cluster. The full list of DEGs in each cluster can be found in Supplementary Table S1 . UMAP, uniform manifold approximation and projection, IPA, ingenuity pathway analysis, DEGs, differentially expressed genes, DAM, disease-associated microglia, avg diff, average difference in expression.
Figure 2
Figure 2
CD14+CD16+ monocytes from Group 1 clusters can be identified by ALCAM, CD52, CD63, and SDC2 surface expression as detected by flow cytometry. (A) Representative flow cytometry gating strategy for comparing MFIs of CD52, CD63, and SDC2 on CD14+CD16+ALCAM+ and CD14+CD16+ALCAM-/lo monocytes. Red histograms represent CD14+CD16+ALCAM+ monocytes, gray histograms represent CD14+CD16+ALCAM-/lo monocytes, and single line histograms represent FMO controls. (B-D) Composite MFI graphs of surface markers CD52, CD63, and SDC2 expressed on CD14+CD16+ALCAM+ (white bars) compared to CD14+CD16+ALCAM-/lo (gray bars) monocytes. Each color and connecting line represent the MFIs for protein expression obtained from cells from each individual donor. Data are representative of n=10-12 independent donors. Significance was determined using paired t-tests (**p<0.01, ***p<0.001). Data are represented as mean ± SEM. MFI, median fluorescence intensity, FMO, fluorescence minus one.
Figure 3
Figure 3
Isolation of Group 1 and Group 2 monocytes by cell sorting is validated by confirming DEGs identified by scRNA-seq that are increased in Group 1 or 2 monocytes by qRT-PCR. Group 1 and Group 2 cells were sorted by gating on CD14+CD16+ALCAM+ and CD14+CD16+ALCAM-/lo monocytes. (A-K) Relative gene expression in cell sorted Group 1 (white bars) and Group 2 (gray bars) monocytes compared using the 2-ΔΔCt method, normalized to the internal control gene 18S. (A-G) Composite graphs of ALCAM (n=13), APOC1 (n=6), APOE (n=8), CHI3L1 (n=9), CTSB (n=4), LGALS3 (n=7), and SPP1 (n=9) that are increased in Group 1 monocytes. (H-K) Composite graphs of genes CLEC7A (n=5), FCGR2B (n=5), and DUSP1 (n=5) analyzed as controls that were higher in Group 2 monocytes, and TPT1 (n=9, p=0.227) as a control that was unchanged in both Group 1 (white bars) and Group 2 (gray bars) monocytes. Each color represents an individual donor. Each gene was tested in triplicate for each group. Significance was determined using one-sample t-tests (*p<0.05, **p<0.01, ***p<0.001, ns, not significant). Data are represented as mean ± SEM. DEGs, differentially expressed genes; FACS, fluorescence-activated cell sorting.
Figure 4
Figure 4
Group 1 monocytes produce more CXCL12, IL-6, TNFα, IL-1Ra, and IL-10 than Group 2 monocytes. (A) Representative flow cytometry plots of inflammatory mediators in CD14+CD16+ALCAM+ (Group 1) (top) and CD14+CD16+ALCAM-/lo (Group 2) (bottom) monocytes. (B-G) Compiled graphs of the percent positive expression of CXCL12, IL-6, TNFα, IL-1Ra, IL-10, and IL-8 by Group 1 (white bar) and Group 2 (gray bar) monocytes. Each color and connecting line represent an individual donor. Data in (B-G) are representative of n=10 independent donors. Significance was determined using paired t-tests (**p<0.01, ***p<0.0001, ns, not significant). Data are represented as mean ± SEM.
Figure 5
Figure 5
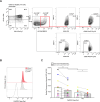
Group 1 monocytes produce more ROS than Group 2 monocytes. (A) Representative gating strategy for identifying Group 1 (CD14+CD16+ALCAM+CD52hiCD63hi) and Group 2 (CD14+CD16+ALCAM-/loCD52loCD63lo) monocytes. (B) Representative histogram overlays of ROS production by Group 1 and Group 2 monocytes as detected by CellROX MFI. The red histogram represents cells gated as Group 1 monocytes, the filled gray histogram represents cells gated as Group 2 monocytes, and the single line histogram represents the CellROX FMO control. (C) Compiled CellROX MFIs between Group 1 (white bar) and Group 2 (gray bar) monocytes at baseline (n=11), and with antioxidant NAC (n=9). Experiments were performed with 3-5 replicates per condition and controls for each donor. Each color and connecting line represent an individual donor. Significance was determined using paired t-tests (*p<0.05, **p<0.01). Data are represented as mean ± SEM. ROS, reactive oxygen species, MFI, median fluorescence intensity, FMO, fluorescence minus one, NAC, N-Acetylcysteine.
Figure 6
Figure 6
Group 1 monocytes preferentially transmigrate across the BBB in greater numbers than Group 2 monocytes. CD14+CD16+ monocytes were cultured for 3 days non-adherently in vitro, added to our human in vitro BBB co-culture model, and allowed to transmigrate for 24 hours to CCL2. Group 1 monocytes were defined by gating on CD14+CD16+ALCAM+ monocytes that had high expression (top 20th percentile) of CD52, CD63, and SDC2. Group 2 was defined by gating on CD14+CD16+ALCAM-/lo cells that had low expression (bottom 20th percentile) for the same proteins. Each marker was evaluated separately on CD14+CD16+ALCAM+ and CD14+CD16+ALCAM-/lo cells. (A) Composite graph of the number of each Group of monocytes post-transmigration divided by the number of each Group of monocytes in the pre-transmigration input population, expressed as the percent of Group 1 (white bar) or Group 2 (gray bar) monocytes, relative to their input that transmigrated across the BBB. (B) Percent of Group 1 monocytes in the pre-transmigration input population (left) and the post-transmigration population (right) using sequential gating for expression of CD52, CD63, and SDC2 on CD14+CD16+ALCAM+ cells. Experiments were performed with n=6 independent donors, with quadruplicate co-culture replicates for samples stained with the full panel of antibodies and each FMO control. Each color represents an individual donor. Significance was determined using a Wilcoxon matched-pairs signed rank test (*p<0.05, ns, not significant). Data are represented as mean ± SEM.

References

    1. Ousman SS, Kubes P. Immune surveillance in the central nervous system. Nat Neurosci. (2012) 15:1096–101. doi: 10.1038/nn.3161 - DOI - PMC - PubMed
    1. Unger ER, Sung JH, Manivel JC, Chenggis ML, Blazar BR, Krivit W. Male donor-derived cells in the brains of female sex-mismatched bone marrow transplant recipients: a Y-chromosome specific in situ hybridization study. J Neuropathol Exp Neurol. (1993) 52:460–70. doi: 10.1097/00005072-199309000-00004 - DOI - PubMed
    1. Ransohoff RM, Engelhardt B. The anatomical and cellular basis of immune surveillance in the central nervous system. Nat Rev Immunol. (2012) 12:623–35. doi: 10.1038/nri3265 - DOI - PubMed
    1. Sugimoto C, Hasegawa A, Saito Y, Fukuyo Y, Chiu KB, Cai Y, et al. . Differentiation kinetics of blood monocytes and dendritic cells in macaques: insights to understanding human myeloid cell development. J Immunol. (2015) 195:1774–81. doi: 10.4049/jimmunol.1500522 - DOI - PMC - PubMed
    1. Zuroff L, Daley D, Black KL, Koronyo-Hamaoui M. Clearance of cerebral Abeta in Alzheimer's disease: reassessing the role of microglia and monocytes. Cell Mol Life Sci. (2017) 74:2167–201. doi: 10.1007/s00018-017-2463-7 - DOI - PMC - PubMed

MeSH terms

LinkOut - more resources