Paradoxical Effect of Myosteatosis on the Immune Checkpoint Inhibitor Response in Metastatic Renal Cell Carcinoma
- PMID: 40052383
- PMCID: PMC11886412
- DOI: 10.1002/jcsm.13758
Paradoxical Effect of Myosteatosis on the Immune Checkpoint Inhibitor Response in Metastatic Renal Cell Carcinoma
Abstract
Background: Treatment for metastatic renal cell carcinoma (mRCC) has shifted from tyrosine kinase inhibitor (TKI) therapy to immune checkpoint inhibitor (ICI)-based therapy, improving outcomes but with variable individual responses. This study investigated the prognostic implications of pretreatment low skeletal muscle mass (LSMM) and myosteatosis in patients with mRCC undergoing first-line ICI-based therapies, comparing outcomes between PD-1 inhibitor + CTLA-4 inhibitor and PD-1 inhibitor + TKI, incorporating single-cell RNA sequencing.
Methods: A retrospective analysis was performed on 90 patients with mRCC treated with ICI-based therapies between November 2019 and March 2023. Patients were grouped based on whether they received PD-1 inhibitor + CTLA-4 inhibitor or PD-1 inhibitor + TKI combinations. LSMM was defined as skeletal muscle index below 40.8 cm2/m2 for men and 34.9 cm2/m2 for women. Myosteatosis was defined using skeletal muscle density, with cut-off values < 41 HU for BMI < 25 kg/m2 and < 33 HU for BMI ≥ 25 kg/m2. Progression-free survival (PFS) and overall survival (OS) were compared using Kaplan-Meier curves and multivariable models. Single-cell RNA sequencing was performed on pretreatment samples to compare the immune microenvironment between patients with and without myosteatosis.
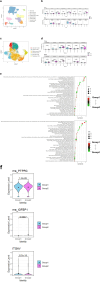
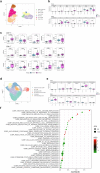
Results: The study cohort (26.7% female; median age: 60.5 years) included 59 patients (65.6%) treated with PD-1 inhibitor + CTLA-4 inhibitor and 31 patients (34.4%) treated with PD-1 inhibitor + TKI. LSMM was present in 18.9% of patients, and myosteatosis in 41.1%, with comparable proportions across groups. During follow-up, 29 patients (32.2%) died: 16 in the PD-1 inhibitor + CTLA-4 inhibitor group and 13 in the PD-1 inhibitor + TKI group. The overall 1-year mortality rate was 22.2%, and PFS rate was 53.3%. Myosteatosis predicted poor OS (HR, 5.389; p = 0.008) and PFS (HR, 2.930; p = 0.022) in the PD-1 inhibitor + TKI group but was protective for PFS (HR, 0.461; p = 0.049) in the PD-1 inhibitor + CTLA-4 inhibitor group. LSMM did not significantly affect outcomes in either group. Single-cell RNA sequencing revealed higher CTLA-4 expression in regulatory T cells and more effector memory CD8+ T cells in patients with myosteatosis, whereas patients without myosteatosis had more anti-tumoural non-classical monocytes.
Conclusions: Myosteatosis negatively impacts OS and PFS in patients with mRCC treated with PD-1 inhibitor + TKI therapy but is protective for PFS in those treated with PD-1 inhibitor + CTLA-4 inhibitor therapy. Altered checkpoint expression and immune cell composition associated with myosteatosis may contribute to these differential responses.
Keywords: body composition; immune checkpoint inhibitors; low skeletal muscle mass; metastatic renal cell carcinoma; myosteatosis; single‐cell RNA sequencing.
© 2025 The Author(s). Journal of Cachexia, Sarcopenia and Muscle published by Wiley Periodicals LLC.
Conflict of interest statement
The authors declare no conflicts of interest.
Figures


References
-
- Heng D. Y., Xie W., Regan M. M., et al., “External Validation and Comparison With Other Models of the International Metastatic Renal‐Cell Carcinoma Database Consortium Prognostic Model: A Population‐Based Study,” Lancet Oncology 14 (2013): 141–148, 10.1016/S1470-2045(12)70559-4. - DOI - PMC - PubMed
-
- Aslan V., Kılıç A. C. K., Sütcüoğlu O., et al., “Cachexia Index in Predicting Outcomes Among Patients Receiving Immune Checkpoint Inhibitor Treatment for Metastatic Renal Cell Carcinoma,” Urologic Oncology 40 (2022): 494.e1–494.e10. - PubMed
-
- McManus H. D., Zhang D., Schwartz F. R., et al., “Relationship Between Pretreatment Body Composition and Clinical Outcomes in Patients With Metastatic Renal Cell Carcinoma Receiving First‐Line Ipilimumab Plus Nivolumab,” Clinical Genitourinary Cancer 21 (2023): e429–e437.e2. - PubMed
MeSH terms
Substances
Grants and funding
LinkOut - more resources
Full Text Sources
Medical
Research Materials

