. 2025 Aug;80(8):2319-2331.
doi: 10.1111/all.16517. Epub 2025 Mar 7.

The Role of IgE in Crohn's Disease by Impairing the Capacity of Plasmacytoid Dendritic Cells to Generate FOXP3+ Tregs

Affiliations

The Role of IgE in Crohn's Disease by Impairing the Capacity of Plasmacytoid Dendritic Cells to Generate FOXP3+ Tregs

Andrés de la Rocha-Muñoz et al. Allergy. 2025 Aug.

Abstract

Background: A causal relationship between Crohn's disease (CD) and asthma is reported, but the underlying mechanisms are not fully understood. We sought to investigate the role of IgE and IgE-mediated pathways in the pathophysiology of CD.

Methods: 20 CD patients, 10 allergic patients without inflammatory bowel disease, and 10 healthy donors (HD) were included in the study. Total serum IgE was quantified by ELISA. Circulating IgE+ and FcεRIα+ immune cells, as well as specific CD4+ T cell populations, were determined by flow cytometry. Gene set enrichment signatures from available single-cell (sc)RNAseq datasets of the intestine from CD patients were analyzed. Purified plasmacytoid dendritic cells (pDCs) from CD patients were cocultured with naïve CD4+ T cells to assess Tregs generation.

Results: CD patients, similar to allergic non-CD patients, displayed significantly higher numbers of circulating IgE+ or FcεRIα+ immune cells than HD. The percentage of blood IgE+ or FcεRIα+ pDCs was significantly higher in CD than HD and similar to allergic non-CD patients. CD patients showed significantly higher numbers of effector memory CD4+ T cells and lower numbers of FOXP3+ Tregs than HD. scRNAseq data from CD patients confirmed that Tregs imbalance and overactivation of IgE-mediated pathways take place also in gut tissues of children and adults, suggesting IgE could interfere in the pDC-Tregs axis. In vitro functional experiments demonstrated that IgE-crosslinking on pDCs from CD patients impairs Treg generation, which was restored by the anti-IgE mAb omalizumab.

Conclusions: IgE might play an unprecedented role in CD by impairing the capacity of pDCs to generate Tregs, which could represent a novel mechanism contributing to CD to be exploited for alternative therapeutic interventions.

Keywords: Crohn's disease; IgE; plasmacytoid dendritic cells; regulatory T cells.


Conflict of interest statement

O.P. received research grants from MINECO, Ministerio de Ciencia e Innovación, CAM, Inmunotek S.L., Novartis, and AstraZeneca, and fees for giving scientific lectures or participation in Advisory Boards fromAstraZeneca, Pfizer, GlaxoSmithKline, Inmunotek S.L., Novartis, Sanofi‐Genzyme, and Regeneron. P.T. and X.J. are Novartis employees. C.T. has served as a speaker, consultant, and advisory board member for MSD, AbbVie, Pfizer, Takeda, Janssen, Galapagos, Lilly, Fresenius Kabi, Ferring, Faes Farma, Shire Pharmaceuticals, Dr. Falk Pharma, and Tillots. The rest of the authors declare no competing financial interests.

Figures

FIGURE 1
FIGURE 1
CD patients display higher numbers of circulating IgE+ and FcεRIα+ immune cells than HD. (A) Serum total IgE levels in HD, CD and A patients as determined by ELISA. (B) Percentage of total IgE+ and FcεRIα+ immune cells in PBMCs from HD, CD and A patients as determined by flow cytometry. Right side, representative dot plots of IgE+ and FcεRIα+ cells from each group. (C) MFI (AU, arbitrary units) of IgE on IgE+ immune cells in PBMCs from HD, CD and A patients. Right side, representative histograms of IgE expression in IgE+ cells in PBMCs from each group compared to the isotype control. (D) Serum total IgE levels vs. the frequency of IgE+ cells in PBMCs from all participants. “r” Pearson correlation coefficient. n (HD) = 8–9, n (CD) = 19–20, n (A) = 10. HD: Healthy donors, CD: Crohn's disease patients, A: Allergic non‐CD patients. Mann–Whitney test or unpaired Student's t test; *p < 0.05, **p < 0.01, ***p < 0.001 and ****p < 0.0001.
FIGURE 2
FIGURE 2
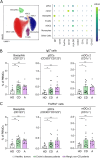
Basophils and DCs from CD patients are sensitized with IgE to a greater extent than those from HD. (A) Identification of immune cell populations from participants using Flow‐SOM algorithm. Left side, representative UMAP plot showing identified populations. Right side, bubble heat map showing the expression of the markers used for the identification of each immune cell population. The color and size of the circles indicate the intensity and relative number of cells expressing each marker, respectively. (B) Percentage of IgE+ basophils, pDCs, and mDCs 2 from HD, CD and A patients. (C) Percentage of FcεRIα+ basophils, pDCs, and mDCs 2 from HD, CD and A patients. n (HD) = 9–10, n (CD) = 18–20, n (A) = 10. HD: Healthy donors, CD: Crohn's disease patients, A: Allergic non‐CD patients. Mann–Whitney test or unpaired Student's t test; *p < 0.05 and **p < 0.01.
FIGURE 3
FIGURE 3
CD patients display lower circulating Tregs and higher effector memory T cells than HD. (A) Identification of CD3+CD4+ cell populations from participants using Flow‐SOM algorithm. Left side, representative UMAP plot showing identified populations. Right side, bubble heat map showing the expression of the markers used for the identification of each CD3+CD4+ T cell population. The color and size of the circles indicate the intensity and relative number of CD3+CD4+ T cells expressing each marker, respectively. Frequency of Tregs (B), naïve CD4+ T cells (C), or effector memory CD4+ T cells (D) in peripheral blood from HD, CD and A patients. n (HD) = 9–10, n (CD) = 19 n (A) = 10. HD: Healthy donors, CD: Crohn's disease patients, A: Allergic non‐CD patients. Unpaired Student's t test; *p < 0.05, **p < 0.01 and ***p < 0.001.
FIGURE 4
FIGURE 4
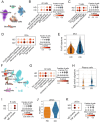
scRNAseq analysis uncover the potentiation of IgE‐FcεRI signaling and imbalanced Th‐responses in the gut of adults and children Crohn's disease patients. (A) UMAP plot illustrating clustering in adult gut single‐cell data. (B) Expression score for the panel of IgE‐related gene signatures across the whole adult single‐cell dataset. (C) Expression score for T helper gene signatures across T cell cluster from adult dataset. (D) Expression score for the panel of IgE‐related gene signatures in DC cluster from the adult dataset. (E) Violin plot depicting the expression score of FcεRI‐related gene signature in DC from adult data. (F) UMAP plot displaying clustering in pediatric gut single‐cell data. (G) Expression score for a panel of T helper gene signatures across the entire single‐cell pediatric dataset. (H‐I) Expression score for the IgE switch gene signature in plasma cell cluster (H) and IgE binding and IgE complex gene signatures in B cell cluster (I) within the pediatric dataset. (J‐K) Expression of the FCERIG gene (J) and IgE binding and TNF‐related gene signature score expression (K) in pDCs cluster. Dot plot: Size depicts % of expressing cells, color intensity encodes mean expression in the group.
FIGURE 5
FIGURE 5
IgE‐FcεRI cross‐linking on pDCs from CD patients impairs the generation of Tregs. (A) Experimental outline. Freshly isolated pDCs from CD patients were incubated with or without omalizumab 10 mg/mL for 18 h. After several washes, pDCs were incubated for 8 h with IgE‐crosslinker or its isotype control at 10 μg/mL. Then, pDCs were stimulated for 18 h with TLR9‐L 2 μM. Finally, pDCs were cocultured for 5 days with allogeneic naïve CD4+ T cells before analysis. (B) Effect of omalizumab incubation on the percentage of IgE+ pDCs isolated from CD patients. (C) Percentages of CD4+CD25highCD127FOXP3+ Tregs induced by pDCs from CD patients (gating in lymphocytes) (n = 17–20). Paired Student's t test, *p < 0.05, **p < 0.01 and ****p < 0.0001. (D) Heatmap showing the total number of interactions with significant means between cell types in the gut dataset from pediatric CD patients and HD obtained with CellPhoneDB. (E) Comparative crosstalk analysis of ligand‐receptor interactions between immune cell populations from intestine of CD patients versus HD. (F) Overview of ligand–receptor interactions between pDCs and Tregs in the gut of CD pediatric patients; P values indicated by circle size, scale on right. The means of the average expression level of interacting molecule 1 in pDC cluster and interacting molecule 2 in Tregs cluster are indicated by color. Significant interactions are marked with red circle. (G) Gene ontology for the ligands and receptor molecules implicated in cell–cell communication between pDCs and Tregs in CD pediatric patients.

References

    1. Ng S. C., Shi H. Y., Hamidi N., et al., “Worldwide Incidence and Prevalence of Inflammatory Bowel Disease in the 21st Century: A Systematic Review of Population‐Based Studies,” Lancet 390 (2017): 2769–2778. - PubMed
    1. Lewis J. D., Parlett L. E., Jonsson Funk M. L., et al., “Incidence, Prevalence, and Racial and Ethnic Distribution of Inflammatory Bowel Disease in the United States,” Gastroenterology 165 (2023): 1197, e2–1205. - PMC - PubMed
    1. Roda G., Chien Ng S., Kotze P. G., et al., “Crohn's Disease,” Nature Reviews Disease Primers 6 (2020): 22. - PubMed
    1. Torres J., Mehandru S., Colombel J. F., and Peyrin‐Biroulet L., “Crohn's Disease,” Lancet 389 (2017): 1741–1755. - PubMed
    1. Baumgart D. C. and Le Berre C., “Newer Biologic and Small‐Molecule Therapies for Inflammatory Bowel Disease,” New England Journal of Medicine 385 (2021): 1302–1315. - PubMed