. 2025 Mar 7:13:RP100424.
doi: 10.7554/eLife.100424.

UNC-6/Netrin promotes both adhesion and directed growth within a single axon

Affiliations

UNC-6/Netrin promotes both adhesion and directed growth within a single axon

Ev L Nichols et al. Elife. .

Abstract

During development axons undergo long-distance migrations as instructed by guidance molecules and their receptors, such as UNC-6/Netrin and UNC-40/DCC. Guidance cues act through long-range diffusive gradients (chemotaxis) or local adhesion (haptotaxis). However, how these discrete modes of action guide axons in vivo is poorly understood. Using time-lapse imaging of axon guidance in C. elegans, we demonstrate that UNC-6 and UNC-40 are required for local adhesion to an intermediate target and subsequent directional growth. Exogenous membrane-tethered UNC-6 is sufficient to mediate adhesion but not directional growth, demonstrating the separability of haptotaxis and chemotaxis. This conclusion is further supported by the endogenous UNC-6 distribution along the axon's route. The intermediate and final targets are enriched in UNC-6 and separated by a ventrodorsal UNC-6 gradient. Continuous growth through the gradient requires UNC-40, which recruits UNC-6 to the growth cone tip. Overall, these data suggest that UNC-6 stimulates stepwise haptotaxis and chemotaxis in vivo.

Keywords: C. elegans; UNC-40/DCC; UNC-6/Netrin; axon guidance; chemotaxis; developmental biology; haptotaxis; neuroscience.


Conflict of interest statement

EN, JL, KS No competing interests declared

Figures
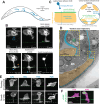
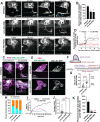
Figure 1.
Figure 1.. The ventral sublateral nerve cord (vSLNC) is an intermediate target for ventrally growing axons.
(A) Diagram of C. elegans illustrating the anteroposterior locations of the neurons which extend ventral axons in the larval stages: AVM, HSN, PDE, PVM, and PQR. (B) Confocal time-lapse images of PDE axon guidance. Images were taken every 3 min for 4 hr in the L2 stage. The final image is a confocal still image visualizing the mature PDE morphology in the L4 stage. Blue arrow denotes PDE soma. White text denotes PVD neuron, PDE sheath glia (PDEsh), and PDE socket glia (PDEso). Green arrowhead denotes the axonal pause in the sublateral region. Orange arrowhead indicates a dorsal branch, and blue arrowhead denotes a ventral branch. (C) Cartoons showing lateral and cross-sectional views of ventral axon navigation in C. elegans. Ventral axons travel along the epidermal edge until they reach the sublateral region. Further ventral growth requires navigation between the epidermis and ventral body wall muscles. (D) Electron microscopic image of PDE axon navigation path (blue) in an adult animal. The dashed yellow box denotes the sublateral region where the axonal trajectory changes. This region is enlarged as an inset on the top left. Orange area denotes body wall muscle. Green circle denotes the vSLNC which is ensheathed by the epidermis in late larval stages. (E) Confocal images of AVM, HSN, PVM, and PQR axon emergence. The top row visualizes axonal contact with the vSLNC. The bottom row visualizes branching toward the ventral nerve cord (VNC). Dashed green line denotes the vSLNC and the dashed gray line denotes the VNC. White arrow denotes PQR dendrite. (F) Confocal images of HSN and PVM axon emergence interacting with the vSLNC. Scale bar is 5 μm in (B, E, F) and 1 μm in (D).
Figure 2.
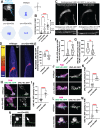
Figure 2.. UNC-6 and UNC-40 promote stabilization and directed growth at the sublateral region.
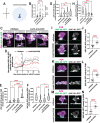
(A) Confocal time-lapse images of PDE axons guidance in wild-type, unc-6(ev400), and unc-40(e1430) animals. Images were taken every 3 min for 4 hr in the L2 stage. Orange arrowhead indicates a dorsal branch, and blue arrowhead denotes a ventral branch. Dashed green line denotes the ventral sublateral nerve cord (vSLNC) and the dashed gray line denotes the ventral nerve cord (VNC). (B) Percentage of axons that stabilize in the sublateral region upon initial contact in wild-type (n = 23), unc-6(ev400) (n = 18), and unc-40(e1430) (n = 21) animals. SE is shown. (C) Airyscan images of PDE axon navigation and endogenous UNC-40::GFP growth cone localization in wild-type and unc-6(ev400) animals. Dashed white box denotes growth cone. (D) Normalized intensity traces of growth cone UNC-40::GFP during axon navigation normalized to sublateral contact (t = 0). Black line denotes wild-type animals (n = 8), and red line denotes unc-6(ev400) animals (n = 8). SEM is shown. (E) Airyscan images of HSN axon emergence and endogenous UNC-40::GFP localization in wild-type and unc-6(ev400) animals. (F) Cartoon schematic of polarity measurements and calculation in (G). (G) UNC-40::GFP polarity in HSN in wild-type (n = 20) and unc-6(ev400) (n = 21) animals. Positive values denote dorsal polarization, and negative values denote ventral polarization. SEM is shown (H) Proportion of branches formed dorsally (orange) and ventrally (cyan) from the sublateral region in wild-type (n = 90 branches, 24 animals), unc-6(ev400) (n = 114 branches, 25 animals), and unc-40(e1430) (n = 114 branches, 28 animals) animals. SE is shown. (I) Representative traces of ventral branch extension in wild-type (black), unc-6(ev400) (magenta), and unc-40(e1430) (green) animals. (J) Average ventral branch extension speed in wild-type (n = 50 branches, 24 animals), unc-6(ev400) (n = 43 branches, 25 animals), and unc-40(e1430) (n = 32 branches, 28 animals) animals. SEM is shown. (K) Percent of axons that stabilize that the VNC within the 4 hr imaging window in wild-type (n = 24), unc-6(ev400) (n = 25), and unc-40(e1430) (n = 28) animals. SE is shown. Scale bars denote 5 μm in (A, C, E). Fisher’s exact test with Bonferonni’s correction is used in (B, H, K). Unpaired Student’s t-test is used in (G). Ordinary one-way ANOVA with multiple comparisons is used in (J). * denotes p < 0.05, ** denotes p < 0.01, *** denotes p<0.001, **** denotes p < 0.0001. All comparisons to wild-type unless otherwise noted.
Figure 2—figure supplement 1.
Figure 2—figure supplement 1.. Axon emergence and UNC-40 polarization are dependent on UNC-6.
(A) Left: Confocal image of PDE axon emergence. Blue angle denotes measured angle of emergence relative to the animal’s posterior. Right: Rose plots of PDE axon emergence. (B) Graph comparing the sine function of axon emergence angle in wild-type, unc-6(ev400), and unc-40(e1430) animals. 1 indicates 90° dorsal axon emergence and –1 indicates 90° ventral axon emergence. (C) Confocal images of UNC-40::GFP in the nerve ring, ventral nerve cord (VNC), and dorsal nerve cord. (D) Confocal images of UNC-40::GFP in the nerve ring. (E) Graph of fluorescent intensity of UNC-40::GFP in the nerve ring. Integrated UNC-40::GFP density along HSN dorsal cell body (E) and HSN contact site with ventral sublateral nerve cord (vSLNC) (F) in wild-type and unc-6(ev400) animals. Airyscan images of UNC-40::GFP in PVM (H), PQR (J), and AVM (L) after vSLNC contact. Graphs of UNC-40::GFP polarity PVM (I), PQR (K), and AVM (M). (N) Confocal images of PDE adult morphology in unc-6(ev400) mutants. Left image shows an axon contacting the VNC and right image shows an axon that has not reached the VNC. Dashed green line denotes vSLNC and dashed gray line denotes VNC. SEM is shown. Scale bar is 5 µm in (A, C, D, H, J, L, N). Ordinary one-way ANOVA with multiple comparisons is used in (B). Unpaired t-test is used in (E–G, I, K, M). ** denotes p < 0.01, *** denotes p<0.001, **** denotes p < 0.0001.
Figure 3.
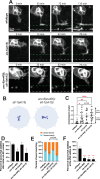
Figure 3.. SLT-1 directs axon emergence trajectory.
(A) Confocal time-lapse images of PDE axons guidance in wild-type, slt-1(eh15), and unc-6(ev400); slt-1(eh15) animals. Images were taken every 3 min for 4 hr in the L2 stage. Dashed green line denotes the ventral sublateral nerve cord (vSLNC) and the dashed gray line denotes the ventral nerve cord (VNC). (B) Rose plot histogram of PDE axon emergence in slt-1(eh15) (n = 24) and unc-6(ev400); slt-1(eh15) (n = 26) animals. (C) Graph comparing the sine function of axon emergence angle in wild-type (n = 22), unc-6(ev400) (n = 27), slt-1(eh15) (n = 24), and unc-6(ev400); slt-1(eh15) (n = 26) animals. 1 indicates 90° dorsal axon emergence and –1 indicates 90° ventral axon emergence. (D) Percentage of axons that stabilize in the sublateral region upon initial contact in wild-type (n = 23), unc-6(ev400) (n = 18), and slt-1(eh15) (n = 8), and unc-6(ev400); slt-1(eh15) (n = 7) animals. SE is shown. (E) Proportion of branches formed dorsally (orange) and ventrally (cyan) from the sublateral region in wild-type (n = 90 branches, 24 animals), unc-6(ev400) (n = 114 branches, 25 animals), and slt-1(eh15) (n = 139 branches, 10 animals), and unc-6(ev400); slt-1(eh15) (n = 69 branches, 10 animals) animals. SE is shown. (F) Percent of axons that stabilize that the VNC within the 4 hr imaging window in wild-type (n = 24), unc-6(ev400) (n = 25), and slt-1(eh15) (n = 10), and unc-6(ev400); slt-1(eh15) (n = 10) animals. SE is shown. Scale bar denote 5 μm in (A). Ordinary one-way ANOVA with multiple comparisons is used in (C). Fisher’s exact test with Bonferonni’s correction is used in (D–F). Ordinary one-way ANOVA with multiple comparisons is used in (C). * denotes p < 0.05, ** denotes p<0.01, *** denotes p < 0.001, **** denotes p < 0.0001. All comparisons to wild-type unless otherwise noted.
Figure 4.
Figure 4.. MADD-2 promotes axon stabilization but not growth.
(A) Confocal time-lapse images of PDE axons guidance in wild-type and madd-2(ok2226) animals. Images were taken every 3 min for 4 hr in the L2 stage. Dashed green line denotes the ventral sublateral nerve cord (vSLNC) and the dashed gray line denotes the ventral nerve cord (VNC). (B) Percentage of axons that stabilize in the sublateral region upon initial contact in wild-type (n = 23), unc-6(ev400) (n = 18), and madd-2(ok2226) (n = 11) animals. SE is shown. (C) Airyscan images of HSN axon emergence and endogenous UNC-40::GFP localization in wild-type, madd-2(ok2226), madd-2(ok2226); unc-6(ev400), unc-40(4KR); and unc-40(4KR); madd-2(ok2226) animals. (D) UNC-40::GFP polarity in HSN in wild-type (n = 20), unc-6(ev400) (n = 21), madd-2(ok2226) (n = 23), and unc-6(ev400); madd-2(ok2226) (n = 19) animals. Positive values denote dorsal polarization, and negative values denote ventral polarization. SEM is shown. (E) Cartoon schematic of the UNC-40 protein sequence. The dashed red box denotes the intracellular lysine residues that are mutated in unc-40(4KR) animals. (F) UNC-40::GFP polarity in HSN in wild-type (n = 20), madd-2(ok2226) (n = 23), unc-40(4KR) (n = 21); unc-40(4KR); madd-2(ok2226) (n = 20) animals. Positive values denote dorsal polarization, and negative values denote ventral polarization. SEM is shown. (G) Proportion of branches formed dorsally (orange) and ventrally (cyan) from the sublateral region in wild-type (n = 90 branches, 24 animals), unc-6(ev400) (n = 114 branches, 25 animals), and madd-2(ok2226) (n = 52 branches, 12 animals) animals. SE is shown. (H) Percent of axons that stabilize that the VNC within the 4 hr imaging window in wild-type (n = 24), unc-6(ev400) (n = 25), and madd-2(ok2226) (n = 12) animals. SE is shown. Scale bars denote 5 μm in (A, C) Fisher’s exact test with Bonferonni’s correction is used in (B, G, H). Ordinary one-way ANOVA with multiple comparisons is used in (D, F). * denotes p < 0.05, *** denotes p < 0.001, **** denotes p < 0.0001. All comparisons to wild-type unless otherwise noted.
Figure 4—figure supplement 1.
Figure 4—figure supplement 1.. UNC-40 polarization, but not axon emergence, is dependent on MADD-2.
(A) Rose plot histogram of PDE axon emergence in madd-2(ok2226) animals. (B) Graph comparing the sine function of axon emergence angle in wild-type, unc-6(ev400), and madd-2(ok2226) animals. 1 indicates 90°dorsal axon emergence and –1 indicates 90° ventral axon emergence. (C) Airyscan images of UNC-40::GFP expression PDE before and after ventral sublateral nerve cord (vSLNC) contact in wild-type and madd-2(ok2226) animals. Dashed box denotes growth cone. (D) Normalized intensity traces of growth cone UNC-40::GFP during axon navigation normalized to sublateral contact (t = 0). Black line denotes wild-type animals, and red line denotes madd-2(ok2226) animals. SEM is shown. Integrated UNC-40::GFP density along HSN dorsal cell body (E) and HSN contact site with vSLNC (F) in wild-type, unc-6(ev400), madd-2(ok2226), and unc-6(ev400); madd-2(ok2226) animals. Integrated UNC-40::GFP density along HSN dorsal cell body (G) and HSN contact site with vSLNC (H) in wild-type, madd-2(ok2226), unc-40(4KR), and unc-40(4KR); madd-2(ok2226) animals. Confocal images of UNC-40::GFP distribution in PVM (I), PQR (K), and AVM (M) in wild-type and madd-2(ok2226) animals. Graphs of UNC-40::GFP polarity PVM (J), PQR (L), and AVM (N) in wild-type and madd-2(ok2226) animals. SEM is shown Scale bar is 5 µm in (C, I, K, M). Ordinary one-way ANOVA with multiple comparisons is used in (B, E–H). Unpaired t-test is used in (J, L, N). * denotes p < 0.05, *** denotes p<0.001, **** denotes p < 0.0001.
Figure 5.
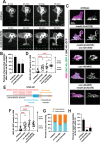
Figure 5.. Diffusible UNC-6 is dispensable for axon stabilization.
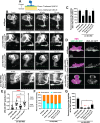
(A) Cartoon schematic of the non-diffusible rescue paradigms at the ventral sublateral nerve cord (vSLNC) (green, using Pmec-7) and at the ventral nerve cord (VNC) (magenta, using Punc-4). (B) Confocal time-lapse images of PDE axons guidance in wild-type, unc-6(ev400); Pmec-7::unc-6, unc-6(ev400); Punc-4::unc-6 and unc-6(ev400); Pmec-7::unc-6; Punc-4::unc-6 animals. Images were taken every 3 min for 4 hr in the L2 stage. Green lines denote the vSLNC and gray lines denote the VNC. Solid lines denote the location of membrane-tethered UNC-6. (C) Percentage of axons that stabilize in the sublateral region upon initial contact in wild-type (n = 23), unc-6(ev400) (n = 18), unc-6(ev400); Pmec-7::unc-6 (n = 10), unc-6(ev400); Punc-4::unc-6 (n = 8), and unc-6(ev400); Pmec-7::unc-6; Punc-4::unc-6 (n = 7) animals. SE is shown. (D) Airyscan images of HSN axon emergence and endogenous UNC-40::GFP localization in wild-type, unc-6(ev400), unc-6(ev400); Pmec-7::unc-6, and unc-6(ev400); Punc-4::unc-6 animals. (E) UNC-40::GFP polarity in HSN in wild-type (n = 20), unc-6(ev400) (n = 21), unc-6(ev400); Pmec-7::unc-6 (n = 25), and unc-6(ev400); Punc-4::unc-6 (n = 18) animals. Positive values denote dorsal polarization, and negative values denote ventral polarization. SEM is shown. (F) Proportion of branches formed dorsally (orange) and ventrally (cyan) from the sublateral region in wild-type (n = 90 branches, 24 animals), unc-6(ev400) (n = 114 branches, 25 animals), unc-6(ev400); Pmec-7::unc-6 (n = 105 branches, 14 animals), unc-6(ev400); Punc-4::unc-6 (n = 83 branches, 10 animals), and unc-6(ev400); Pmec-7::unc-6; Punc-4::unc-6 (n = 108 branches, 15 animals) animals. SE is shown. (G) Percent of axons that stabilize that the VNC within the 4 hr imaging window in wild-type (n = 24), unc-6(ev400) (n = 25), unc-6(ev400); Pmec-7::unc-6 (n = 14), unc-6(ev400); Punc-4::unc-6 (n = 10), and unc-6(ev400); Pmec-7::unc-6; Punc-4::unc-6 (n = 15) animals. SE is shown. Scale bars denote 5 μm in (B, D). Fisher’s exact test with Bonferonni’s correction is used in (C, F, G). Ordinary one-way ANOVA with multiple comparisons is used in (E). * denotes p < 0.05, ** denotes p < 0.01, **** denotes p < 0.0001. All comparisons to wild-type unless otherwise noted.
Figure 5—figure supplement 1.
Figure 5—figure supplement 1.. Membrane-tethered UNC-6 is not sufficient to explain axon emergence.
(A) SNAP labeling of unc-6(ev400); Pmec-7::unc-6; Punc-4::unc-6 animals. (B) Rose plot histograms of PDE axon emergence in unc-6(ev400); Pmec-7::unc-6 and unc-6(ev400); Punc-4::unc-6. (C) Graph comparing the sine function of axon emergence angle in wild-type, unc-6(ev400), unc-6(ev400); Pmec-7::unc-6 and unc-6(ev400); Punc-4::unc-6 animals. 1 indicates 90° dorsal axon emergence and –1 indicates 90° ventral axon emergence. (D) Confocal images of Pmec-7::unc-6 and Punc-4::unc-6 animals showing normal PDE axon interactions with the ventral sublateral nerve cord (vSLNC). Integrated UNC-40::GFP density along HSN dorsal cell body (E) and HSN contact site with vSLNC (F) in wild-type, unc-6(ev400), unc-6(ev400); Pmec-7::unc-6 and unc-6(ev400); Punc-4::unc-6 animals. Scale bar is 3 µm in (A) and 5 µm in (D). Ordinary one-way ANOVA with multiple comparisons is used in (C, E, F). * denotes p < 0.05, ** denotes p < 0.01, **** denotes p < 0.0001.
Figure 6.
Figure 6.. UNC-6 is present in a gradient.
(A) Airyscan images of axon emergence in PDE and endogenous UNC-6::mNG distribution in wild-type animals. (B) Airyscan images of axon extension in HSN, PDE, and AVM and endogenous UNC-6::mNG distribution in wild-type animals. White arrowheads denote UNC-6 clusters around axonal filopodia. Dashed green line denotes ventral sublateral nerve cord (vSLNC) and dashed gray line denotes ventral nerve cord (VNC). (C) Average intensity of UNC-6::mNG between the VNC (left) and vSLNC (right) in wild-type animals (n = 49 animals). (C) Airyscan images of axon extension in HSN, PDE, and AVM and endogenous UNC-6::mNG distribution in unc-40(e1430) animals. Dashed green line denotes vSLNC and dashed gray line denotes VNC. (D) Average intensity of UNC-6::mNG between the VNC (left) and vSLNC (right) in unc-40(e1430) animals (n = 37 animals). SEM is shown. Scale bars denote 5 μm in (A, B).
Figure 6—figure supplement 1.
Figure 6—figure supplement 1.. Levels of autofluorescence in the region between the ventral sublateral nerve cord (vSLNC) and ventral nerve cord (VNC) are low.
Airyscan images of axon extension in HSN, PDE, and PVM in wild-type animals lacking endogenous UNC-6::mNG. Images were taken and processed with the same protocols as images in Figure 6A, B, D. Scale bar is 5 µm.
Figure 7.
Figure 7.. UNC-6 clusters are dynamically assembled at the growth cone tip during axon extension.
(A) Airyscan time-lapse images of HSN axon extension and endogenous UNC-6::mNG in wild-type and unc-40(e1430) animals. Images were taken every 30 s for 30 min. White arrowhead denotes the growth cone tip. Dashed white circle denotes UNC-6 clusters on the lateral edges of the growth cone. (B) Intensity of UNC-6 foci adjacent to the growth cone membrane in wild-type (n = 861 foci, 5 animals) and unc-40(e1430) (n = 1306 foci, 5 animals) animals. (C) Model of ventral axon migration via alternating haptotaxis and chemotaxis. Scale bar denotes 1 μm in (A). Unpaired Student’s t-test is used in (B). **** denotes p < 0.0001.

Update of

  • doi: 10.1101/2024.06.05.597665
  • doi: 10.7554/eLife.100424.1
  • doi: 10.7554/eLife.100424.2

Comment in

  • doi: 10.7554/elife.106190

References

    1. Adler CE, Fetter RD, Bargmann CI. UNC-6/Netrin induces neuronal asymmetry and defines the site of axon formation. Nature Neuroscience. 2006;9:511–518. doi: 10.1038/nn1666. - DOI - PMC - PubMed
    1. Akin O, Zipursky SL. Frazzled promotes growth cone attachment at the source of a Netrin gradient in the Drosophila visual system. eLife. 2016;5:e20762. doi: 10.7554/eLife.20762. - DOI - PMC - PubMed
    1. Basu A, Behera S, Bhardwaj S, Dey S, Ghosh-Roy A. Regulation of UNC-40/DCC and UNC-6/Netrin by DAF-16 promotes functional rewiring of the injured axon. Development. 2021;148:dev198044. doi: 10.1242/dev.198044. - DOI - PMC - PubMed
    1. Bentley D, Caudy M. Pioneer axons lose directed growth after selective killing of guidepost cells. Nature. 1983a;304:62–65. doi: 10.1038/304062a0. - DOI - PubMed
    1. Bentley D, Caudy M. Navigational substrates for peripheral pioneer growth cones: limb-axis polarity cues, limb-segment boundaries, and guidepost neurons. Cold Spring Harbor Symposia on Quantitative Biology; 1983b. pp. 573–585. - DOI - PubMed

MeSH terms

LinkOut - more resources