. 2025 May 5;224(5):e202404009.
doi: 10.1083/jcb.202404009. Epub 2025 Mar 7.

SNX10 functions as a modulator of piecemeal mitophagy and mitochondrial bioenergetics

Affiliations

SNX10 functions as a modulator of piecemeal mitophagy and mitochondrial bioenergetics

Laura Trachsel-Moncho et al. J Cell Biol. .

Abstract

We here identify the endosomal protein SNX10 as a negative regulator of piecemeal mitophagy of OXPHOS machinery components. In control conditions, SNX10 localizes to early endocytic compartments in a PtdIns3P-dependent manner and modulates endosomal trafficking but also shows dynamic connections with mitochondria. Upon hypoxia-mimicking conditions, SNX10 localizes to late endosomal structures containing selected mitochondrial proteins, including COX-IV and SAMM50, and the autophagy proteins SQSTM1/p62 and LC3B. The turnover of COX-IV was enhanced in SNX10-depleted cells, with a corresponding reduced mitochondrial respiration and citrate synthase activity. Importantly, zebrafish larvae lacking Snx10 show reduced levels of Cox-IV, as well as elevated ROS levels and ROS-mediated cell death in the brain, demonstrating the in vivo relevance of SNX10-mediated modulation of mitochondrial bioenergetics.


Conflict of interest statement

Disclosures: The authors declare no competing interests exist.

Figures

Figure 1.
Figure 1.
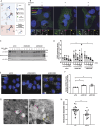
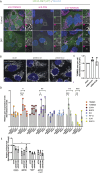
SNX10 localizes to early and late endocytic compartments. (A) Graphical view of the SNX10 isoforms annotated in UniProt. The PX domain is represented in green, and the numbers indicate the number of amino acids. The arrows indicate the position of the natural variants (SNPs) linked to ARO (Y32S, R51P, and R51Q). (B) The figure displays the predicted protein structure of SNX10 generated using AlphaFold, showcasing its three-dimensional conformation. (C) Confocal imaging of U2OS cell lines stably expressing doxycycline-inducible SNX10-EGFP WT or the indicated ARO-linked mutants. Nuclei were stained with Hoechst. Scale bar: 20 µm. (D) Representative immunoblot showing the expression levels of SNX10-EGFP and the indicated ARO mutants. The membrane was blotted using an anti-GFP antibody and using actin as a loading control. (E) Representative immunofluorescence images of U2OS cells stably expressing SNX10-EGFP WT or the Y32S mutant (green) immunostained with anti-EEA1 (magenta) after treating cells with 5 µM VPS34-IN1 for 2 h. Nuclei were stained with Hoechst. Scale bar: 10 µm. Insets: 9.35 × 9.35 µm. (F) Representative image of U2OS cells stably expressing SNX10-EGFP and immunostained with anti-CD63 (magenta) and anti-EEA1 (yellow) antibodies. Images were taken with a Nikon CREST X-Light V3 spinning disk microscope using a 60× oil objective (NA 1.42). Scale bar: 10 µm. Insets: 5.12 × 5.12 µm. (G) Quantification of F represented as the percentage of SNX10 structures that are either CD63- or EEA1-positive. Data are mean ± SEM with individual data points corresponding to a single field of view (n > 300 cells, four experiments). The significance was assessed by unpaired t test. Data distribution was assumed to be normal, but this was not formally tested. (H) Representative immunofluorescence images of U2OS cells stably expressing SNX10-EGFP WT or the Y32S mutant (green) immunostained with anti-LAMP1. Scale bar: 10 µm. Insets: 10.43 × 10.43 µm. (I) U2OS SNX10-EGFP cells fixed for CLEM analysis. The area analyzed and shown in (ii) is indicated with a square in the confocal image (i). (iii) Shows the transmission EM and (iv) the z-slide from the tomogram from the white dotted area shown in (ii). The white arrows indicate clathrin-coated vesicles. (v) Green: endosomes; red: lipid droplets; yellow: vesicles; and pink: clathrin-coated vesicles. Scale bars: 10 μm (i and ii), 1 μm (iii and iv). SNPs; single nucleotide polymorphisms. Source data are available for this figure: SourceData F1.
Figure S1.
Figure S1.
SNX10 localizes to endocytic structures. (A) Fluorescence imaging of U2OS cell lines stably expressing doxycycline-inducible SNX10-EGFP WT or the indicated ARO-linked mutants was acquired at 20× magnification using a Zeiss Axio Observer widefield microscope (Zen Blue 2.3; Zeiss). Corresponding brightfield images are displayed below the fluorescence images. Pink arrows correspond to observed vacuoles. Scale bar = 20 µm. (C) U2OS cells stably expressing SNX10-EGFP were treated with LysoTracker Red prior to fixation. Scale bars: 10 μm. Insets: 8.40 × 8.40 µm. (B) U2OS cells with stable inducible expression of SNX10-EGFP were infected with lentiviral particles to express mScarlet-RAB4/RAB5/RAB6/RAB7/RAB9/RAB11/RAB43. Nuclei were stained with Hoechst. Scale bars: 10 μm. Insets: 10.92 × 10.92 µm. (D) U2OS cells with stable inducible expression of SNX10-EGFP were fixed and stained against endogenous clathrin. Nuclei were stained with Hoechst. Scale bar: 10 μm. Insets: 9.48 × 9.48 µm.
Figure 2.
Figure 2.
SNX10 regulates endocytic trafficking. (A) Graphical description of the plasma membrane EGFR staining. Live cells are put on ice and (1) incubated for 20 min with the primary anti-EGFR antibody, then washed and (2) incubated with a secondary antibody for 20 min, followed by (3) incubation with EGF for 15 or 50 min at 37°C before fixation and imaging. (B) U2OS SNX10-EGFP cells were incubated with anti-EGFR antibody as described in A, then stimulated with EGF and fixed. Cells were stained with an anti-EFG antibody after fixation. Scale bar: 10 µm. Insets: 7.24 × 7.24 µm. (C) After 72 h of siRNA transfection with siCtrl (control) or two different siSNX10 oligoes (siSNX10#1 and siSNX10#2), U2OS cells were serum starved for 2 h and then incubated with 50 ng/ml EGF + 10 µg/ml cycloheximide (CHX) for the indicated times. The cells were lysed, followed by western blotting for the indicated proteins. (D) Quantification of EGFR protein levels normalized to actin in n = 3 independent experiments ± SEM. Significance was determined by two-way ANOVA followed by Tukey’s multiple comparisons test. Normality was assumed but not formally tested. (E) Cells were transfected with siCtrl, siSNX10#1 or siSNX10#2 prior to fixation and staining for endogenous EEA1. Images were taken with Zeiss Axio Observer widefield microscope (Zen Blue 2.3; Zeiss), and a 20× objective was used. Scale bar: 10 µm. (F) Quantification of the data shown in E was performed using CellProfiler software. The values were obtained from analyzing >1,000 cells per condition, and they were normalized to control siRNA (siCtrl). The graphs display the mean values ± SEM from n = 3 independent experiments. The significance was assessed by ordinary one-way ANOVA followed by Bonferroni’s post hoc test. Data distribution was assumed to be normal but was not formally tested. (G) Representative EM images of endosomes in U2OS cells (control and siSNX10 #1). Pink arrows: Protein A conjugated with 10 nm gold (PAG10)-labeling EGFR that has been taken up into endosomes. Yellow arrows: endosome not containing internalized PAG10-labeled EGFR. Scale bar: 0.5 µm. (H) Measurements of EGFR-containing endosome diameter in control versus siSNX10-treated cells from one experiment. The graph shows the endosomal diameter (nm) of a total 24 PAG10-labeled EGFR endosomes in siCtrl cells and 15 PAG10-labeled EGFR endosomes in siSNX10 cells. The graph displays the mean values ± SEM. Significance was determined by unpaired t test with Welch’s correction in all graphs, and data distribution was assumed to be normal but was not formally tested. * = P < 0.05 and ** = P < 0.01, nonsignificant differences are not depicted. Source data are available for this figure: SourceData F2.
Figure 3.
Figure 3.
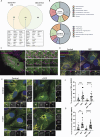
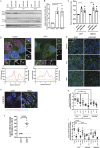
SNX10 localizes nearby mitochondria. (A) SNX10-EGFP WT or the Y32S mutant, stably expressed in U2OS cells, underwent GFP pulldown for the subsequent analysis of their interactome using mass spectrometry assays. A total of 53 proteins were identified as significant SNX10-EGFP interactors compared with the EGFP control, as analyzed by R lima using a cut-off value of log2FC >1 and adjusted P value <0.05. The Venn diagram illustrates the distinct and shared interactors between the SNX10 WT and Y32S mutant, where the identified significant SNX10-EGFP–interacting proteins are listed below. (B) The interacting proteins of SNX10 WT were enriched for GO term analysis. Their cellular component (upper pie chart) and biological processes (lower pie chart) enrichment is expressed in percentage toward the significant hits. Graphs were plotted using Plotly (Python package). (C) U2OS with stable inducible expression of SNX10-EGFP were treated with doxycycline for 24 h before incubation with MitoTracker Red for 30 min, followed by live imaging with an acquisition speed of 1 frame every 500 ms. Scale bar: 10 µm. (D) U2OS cells stably expressing mScarlet-RAB5 and with inducible expression of SNX10-EGFP were stained with MitoTracker Deep Red FM in the presence or absence of DFP (1 µM). Scale bar: 10 µm. (E) U2OS SNX10-EGFP cells were treated or not with DFP (1 µM) for 24 h in the absence or presence of the ULK1 inhibitor MRT68921 (1 µM) for 1 h. MitoTracker Deep Red FM (100 nM) was added for 1 h, followed by immunofluorescence staining with antibody against LC3B. Scale bars: 10 µm. Insets 5.77 × 5.77 µm. (F and G) Quantification of the percentage of the co-occurrence of LC3 on SNX10 structures (F) and of LC3 on MitroTracker-SNX10–positive structures (G). Data are mean ± SEM with individual data points corresponding to a single field of view (n = 4 [F] and n = 3 [G], corresponding experiment shown in the same color, >150 cells per experiment). The statistical significance was calculated with ordinary one-way ANOVA, followed by Tukey’s multiple comparison test. Data distribution was assumed to be normal, but this was not formally tested. * = P < 0.05, ** = P < 0.01, *** = P < 0.001, and **** = P < 0.0001; nonsignificant differences are not depicted. GO; Gene Ontology.
Figure 4.
Figure 4.
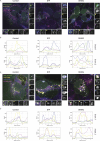
SNX10 structures containing mitochondria mature into late endosomes. (A and C) U2OS cells with inducible expression of SNX10-EGFP were treated with DFP (1 µM) or DMOG (1 µM) for 24 h, stained with MitoTracker Deep Red FM (100 nM) for 30 min, followed by immunofluorescence with antibodies anti-LC3B and anti-EEA1 (A) or anti-CD63 (C), prior to acquisition with a Nikon CREST X-Light V3 spinning disk microscope using a 60× oil objective (NA 1.42). Scale bar: 10 µm. Insets: 5.52 × 5.52 µm (A), 6.62 × 6.62 µm (C). (B–D) Pixel intensity plots for line in control, DFP, and DMOG insets, respectively for A and C.
Figure 5.
Figure 5.
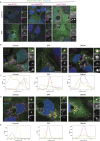
SNX10 vesicles contain mitochondrial proteins and LC3B. (A) U2OS cells with stable inducible expression of SNX10-EGFP were pre-treated with doxycycline for 16 h before the addition of DFP (1 µM) for 24 h. The cells were fixed and stained with antibodies against mitochondrial proteins. Scale bars: 10 µm. Insets: 8.57 × 8.57 µm. (B and D) U2OS cells with inducible expression of SNX10-EGFP were treated with DFP (1 µM) or DMOG (1 µM) for 24 h and stained with antibodies anti–COX-IV and anti-LC3B in B or anti-LAMP1 in D, prior to acquisition with a Nikon CREST X-Light V3 spinning disk microscope using a 60× oil objective (NA 1.42). Scale bar: 10 µm. Insets: 4.41 × 4.41 µm (B), 5.52 × 5.52 µm (D). (C–E) Pixel intensity plots for line in control, DFP, and DMOG insets, respectively for (B and D).
Figure S2.
Figure S2.
SNX10 modulates COX-IV protein levels. (A) U2OS cells with stable inducible expression of SNX10-EGFP were pre-treated with doxycycline for 16 h before the addition of DFP for 24 h. The cells were fixed and stained with antibodies against the indicated mitochondrial proteins for subsequent analysis. Scale bars: 10 μm. Insets: 8.57 × 8.57 µm. (B) Representative images of U2OS cells transfected with 20 nM siRNA: siCtrl (control) and two different siSNX10 oligoes (siSNX10 #1 and siSNX10 #2). Cells were stained with an anti-TOMM20 antibody after fixation. Images were acquired using a Nikon CREST X-Light V3 spinning disk microscope utilizing a 60× oil objective. Scale bar: 10 µm. (C) Quantification of the data shown in B, performed using CellProfiler software. The graph displays the area occupied by TOMM20 per cell (n = 3, >100 cells per condition in each replicate). Significance was assessed by ordinary one-way ANOVA followed by Tukey’s multiple comparison test. Data distribution was assumed to be normal but was not formally tested. (D) U20S cells were reverse transfected with the indicated siRNA (20 nM) for 72 h. The cells were lysed in the well, and the RNA was extracted prior to cDNA synthesis. The graph shows the difference in expression levels upon KD of the different proteins (mean values ± SEM). The values were normalized to TBP using the 2−ΔΔCt method and then compared with siCtrl control. Significance was determined from n = 2 independent experiments by one-way ANOVA followed by Dunnetts’s multiple comparison test. Data distribution was assumed to be normal but was not formally tested. (E) Quantification of COX-IV protein expression levels in control (siCtrl) and SNX10 (siSXN10#1, siSXN10#2) depleted cells upon treatment of MG132 and/or DFP across three independent experiments. Band densities were normalized to the housekeeping gene actin. Data are presented as mean ± SEM. Statistical analysis was performed using one-way ANOVA followed by Šídák’s multiple comparisons test to compare each knockdown group to the control group. Data distribution was assumed to be normal but was not formally tested. * = P < 0.05, ** = P < 0.01, *** = P < 0.001, and **** = P < 0.0001; nonsignificant differences are not depicted. TBP; TATA-box–binding protein and KD; knockdown.
Figure 6.
Figure 6.
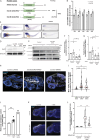
SNX10 is a negative modulator of COX-IV turnover. (A) U2OS cells were reverse transfected with the indicated siRNA (20 nM) for 72 h, then treated or not with DFP (1 µM) for 24 h and with BafA1 (50 nM) the last 16 h, followed by western blotting for the indicated proteins. (B–D) Quantification of the data in A from n = 5, 3, and 6 independent experiments. Bars show mean values of the protein levels normalized to actin relative to control conditions (siCtrl control) ± SEM. Significance is assessed by two-way ANOVA followed by Tukey’s post hoc test. Data distribution was assumed to be normal. (E) U2OS cells with stable expression of mScarlet-RAB5 were reverse transfected with the indicated siRNA (20 nM) for 72 h, then treated or not with DFP for 24 h. The cells were fixed and stained with anti–COX-IV antibody before image acquisition. Scale bar: 10 µm. Insets: 3.69 × 3.69 µm. (F) Quantification of COX-IV intensity from E represented as z-score from two independent experiments (>250 cells per experiment). The statistical significance between the control and the other conditions was calculated with ordinary one-way ANOVA followed by Tukey’s multiple comparison test. Data distribution was assumed to be normal but was not formally tested. * = P < 0.05, ** = P < 0.01, *** = P < 0.001, and **** = P < 0.0001; nonsignificant differences are not depicted. BafA1; bafilomycin A1. Source data are available for this figure: SourceData F6.
Figure 7.
Figure 7.
SNX10 modulates piecemeal mitophagy of OXPHOS components. (A) U2OS cells stably expressing the reporter pSu9-Halo-mGFP were reverse transfected with siCtrl or siSNX10 for 72 h. Cells were treated with TMR (100 nM) for 20 min, washed three times with PBS, and then treated with DFP (1 µM), DMOG (1 µM), or left untreated (control) for 24 h before lysis. (B and C) The relative Free Halo Tag expression was quantified using the formula (Free Halo/[Free Halo + Full Length]) normalized to actin. Data in B were log2 transformed. Statistical analysis was performed using one-way ANOVA followed by Dunnett’s multiple comparison tests to compare treatment groups to the control. Data represent mean ± SEM from three independent experiments. Data distribution was assumed to be normal but was not formally tested. (D) U2OS cells with inducible expression of SNX10-EGFP were treated with or without DFP (1 µM) for 24 h and stained with antibodies anti–COX-IV and anti-p62, followed by acquisition with a Nikon Ti2-E microscope with a Yokogawa CSU-W1 SoRa spinning disk 100×/1.45 NA oil immersion objective. Pixel intensity plot line graphs from control and DFP insets were generated with GraphPad Prism using two different y axis to enhance visualization. Scale bar: 10 µm. Insets: 4.08 × 4.08 µm. (E) U2OS cells subjected to reverse transfection with sip62 (20 nM) for 72 h were stained with an anti–COX-IV and anti-p62 antibody, prior to acquisition with a Nikon Ti2-E microscope with a Yokogawa CSU-W1 SoRa spinning disk 100×/1.45 NA oil immersion objective. 100×/1.45 NA oil immersion objective. Scale bar: 10 µm. (F) Quantification of COX-IV intensity from E represented as z-score from one experiment with individual data points corresponding to a single field of view (>30 cells per siRNA). Significance was determined by an unpaired two-tailed t test. Data distribution was assumed to be normal, but this was not formally tested. (G) Representative images of U2OS cells subjected to reverse transfection with siSNX10 (20 nM) for 72 h, followed by treatment with either IN1 or MRT for 24 h before fixation. After fixation, cells were stained with a COX-IV antibody, and images were captured using an ImageXpress Micro Confocal (Molecular Devices) at 20× magnification. (H and I) Quantification of COX-IV intensity from G represented as z-score from one independent experiment, with individual data points corresponding to a single field of view (>200 cells were analyzed for each condition). Significance was determined by one-way ANOVA followed by Šídák’s multiple comparisons test. Data distribution was assumed to be normal, but this was not formally tested. * = P < 0.05, ** = P < 0.01, *** = P < 0.001, and **** = P < 0.0001; nonsignificant differences are not depicted. Source data are available for this figure: SourceData F7.
Figure S3.
Figure S3.
SNX10 is dispensible for mitophagy of a matrix reporter and MDV formation. (A) U2OS cells stably expressing iMLS-GFP-mCherry were reverse transfected with Ctrl, SNX10, or ULK1 siRNAs (20 nM) for 72 h. DFP was added for the last 24 h and 50 nM BafA1 was added 16 h before fixation. Scale bar: 20 µm. The graph represents the mitolysosome area per cell from >1,000 cells based on images taken with ImageXpress Micro Confocal (Molecular devices) at 20× magnification. The bars show the means normalized to the control (siCtrl) cells ± SEM (n = 3). Significance was determined by two-way ANOVA followed by Tukey’s multiple comparison test. (B) U2OS cells stably expressing MLS-GFP-mCherry and non-tagged Parkin were reverse transfected with Ctrl and SNX10 siRNAs (20 nM) for 72 h. CCCP was added for the last 24 h and 50 nM BafA1 was added 2 h before fixation. Scale bar: 20 µm. The graph represents the mitolysosome area per cell from >1,000 cells based on images taken with ImageXpress Micro Confocal (Molecular devices) at 20× magnification. The bars show the means normalized to the control (siCtrl) cells ± SEM (n = 3). Significance was determined by two-way ANOVA followed by Tukey’s multiple comparison test. (C) Representative images of U2OS cells transfected with 20 nM siRNA: siCtrl (control) and two different siSNX10 oligoes (siSNX10 #1 and siSNX10 #2). Cells were stained with an anti-PDH and anti-TOMM20 antibody after fixation. Images were acquired using a Nikon CREST X-Light V3 spinning disk microscope utilizing a 60× oil objective. Scale bar: 10 µm. (D) Quantification of the data shown in C, performed using CellProfiler software. The graph displays the number of MDVs per cell, calculated as vesicles positive for TOMM20 only or PDH only (n = 3, >100 cells per condition in each replicate). Significance was assessed by two-way ANOVA followed by Dunnett’s multiple comparison test. Data distribution was assumed to be normal but was not formally tested. BafA1; bafilomycin A1 and CCCP; carbonyl cyanide m-chlorophenyl hydrazine.
Figure 8.
Figure 8.
SNX10 is important for mitochondrial bioenergetics. (A) Mitochondrial oxygen consumption rate (OCR) was assessed in control and SNX10 knocked down cells using the Seahorse XFe24 Analyzer. OCR was measured following sequential addition of oligomycin, carbonyl cyanide m-chlorophenyl hydrazone (CCCP), and rotenone/antimycin A (Rot/AntiA). (B) The four basal OCR measurements per well were averaged to determine the basal OCR value, and non-mitochondrial respiration was subtracted to ascertain the basal respiration associated with each condition. (C) ATP production was calculated by subtracting the proton leak from the maximal respiratory capacity. Error bars represent the mean ± SEM from n = 5. Statistical significance was determined using one-way ANOVA followed by Dunnett’s multiple comparison test. Data distribution was assumed to be normal but was not formally tested. (D) CS activity was determined by spectrophotometry from lysates of U2OS cells transfected with siRNA for 72 h, in the presence or absence of DFP for the last 24 h. The graph displays mean values normalized to siCtrl. Significance was determined from n = 3 independent experiments by two-way ANOVA followed by Tukey’s multiple comparison test. Data distribution was assumed to be normal but was not formally tested. (E and F) Expression levels of CS were measured in control (siCtrl) and SNX10 knockdowns (siSXN10#1 and siSXN10#2) across three independent experiments. Band densities of CS were normalized to the housekeeping gene GAPDH. Data are presented as mean ± SEM. Statistical analysis was performed using one-way ANOVA followed by Dunnett’s post hoc test to compare each knockdown group to the control group. Data distribution was assumed to be normal but was not formally tested. * = P < 0.05, ** = P < 0.01, *** = P < 0.001, and **** = P < 0.0001; nonsignificant differences are not depicted. Source data are available for this figure: SourceData F8.
Figure 9.
Figure 9.
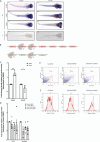
SNX10 regulates mitochondrial homeostasis and cell death in vivo. (A) Schematic diagram of human SNX10, zebrafish Snx10a, and Snx10b proteins. The percentage identity of the orthologues amongst each other and to the human counterpart is indicated. Also, the percentage identity of the zebrafish PX domains in comparison with the PX domain of human SNX10 is shown. (B) Temporal expression pattern of snx10a and snx10b. The graph shows the fold change in transcript levels relative to β-actin in whole zebrafish embryos from 1 to 5 dpf. Error bars indicate mean ± SEM. Data are collected from three individual experiments using 30 larvae for each experiment. (C) Dorsal and lateral view of the spatial expression pattern of snx10a and snx10b at 3 dpf as demonstrated by WM-ISH using an internal probe. Scale bars: 200 μm. Images are representative from three experiments. (D) Representative immunoblots of Snx10 and β-tubulin on whole embryo lysates from control (scrambled guide), single snx10a KO, and snx10ab DKO animals. β-tubulin served as a loading control. (E) Representative immunoblots of Snx10, Samm50, Cox-IV, and actin on whole embryo lysates from control (scrambled guide) and snx10ab DKO treated with 100 µM DMOG or DMSO control for 24 h at 2 dpf. (F) Quantification of the Cox-IV signal intensity from blots in E normalized to control DMSO signal intensity from n = 4 experiments. Error bars indicate mean ± SEM, unpaired Student’s t test was performed to assess significance. (G) Quantification of the Samm50 signal intensity from blots in E normalized to control DMSO signal intensity from n = 4 experiments. Error bars indicate mean ± SEM, unpaired Student’s t test was performed to assess significance. Data distribution was assumed to be normal but was not formally tested. (H) Representative images of TUNEL assay on control (scrambled sgRNA) and snx10ab DKO larvae treated with 100 µM DMOG or DMSO control for 24 h at 3 dpf. Orientation lateral. Scale bar: 500 μm. (I) Quantification of the mean fluorescent intensity from demarcated brain regions of images in H. A total of 45 control larvae (scrambled sgRNA) and 41 snx10ab DKO larvae were used for quantification, respectively. Values were normalized to control DMSO values. Control larvae were treated with DMOG as a comparison to snx10ab DKO larvae. n = 2 independent experiments. Plots demonstrate data distribution and median value (red line). Significance was determined by two-way ANOVA followed by Tukey’s post hoc test to compare all groups. Data distribution was assumed to be normal but was not formally tested. (J) Quantification of ROS levels obtained via FACS analysis of control (scrambled sgRNA), snx10ab DKO, and positive control larvae at 3 dpf incubated with MitoSOX. The values were presented as relative values after normalizing to control. Error bars indicate mean ± SEM. Quantification was from at least two independent experiments. Data distribution was assumed to be normal but was not formally tested. (K) Representative whole mount images shown as maximum intensity projection from z-stack of TUNEL assay performed on control (scrambled sgRNA) and snx10ab DKO larvae treated with or without 100 µM NAC at 3 dpf. Orientation lateral. Scale bar: 500 µm. (L) Quantification of the number of white puncta (dots) from the demarcated whole brain region shown in K. A total of >20 control larvae (scrambled gRNA) and >20 snx10ab DKO larvae treated or not with 100 µM NAC were used for quantification. Values were normalized to control values. Data are collected from three individual experiments. Plots show data distribution and median value (red line). Significance was determined by one-way Brown–Forsythe and Welch’s ANOVA tests to compare all groups. Data distribution was assumed to be normal but was not formally tested. * = P < 0.05, ** = P < 0.01, *** = P < 0.001, and **** = P < 0.0001; nonsignificant differences are not depicted. NAC; N-acetyl cysteine. Source data are available for this figure: SourceData F9.
Figure S4.
Figure S4.
s nx10 is highly expressed in the brain of zebrafish larvae and its depletion elevates oxidative stress. (A) Dorsal view of spatial expression pattern of snx10a and snx10b at 2, 4, and 5 dpf as demonstrated by WM-ISH using an internal antisense (AS) probe. Scale bar = 200 μm. Images are representative of three experiments. Control 2 dpf larvae hybridized to a sense probe (S). (B) Illustration of sgRNA-binding regions on snx10a and snx10b gene, respectively. (C) Temporal expression levels of bnip3 and bnip3l transcripts in DMSO- and DMOG-treated WT zebrafish larvae at 3 dpf. The graph shows the fold change in transcript levels relative to β-actin and normalized to DMSO 2−ΔΔCt levels. Error bars indicate mean ± SEM. Data are collected from three individual experiments. Significance was determined by two-way ANOVA test to compare all groups with the two variables. (D) Temporal expression levels of cox-iv and samm50 transcripts in control and snx10ab_DKO zebrafish larvae treated with or without 100 µm DMOG at 3 dpf. The graph shows the fold change in transcript levels relative to β-actin and normalized to DMSO 2−ΔΔCt levels. Error bars indicate mean ± SEM. Data are collected from three individual experiments. Significance was determined by one-way ANOVA test to compare all groups with the individual variable. Data distribution was assumed to be normal but was not formally tested. * = P < 0.05, ** = P < 0.01, *** = P < 0.001, and **** = P < 0.0001; nonsignificant differences are not depicted. (E) Representative dot plots showing the region selected for FACS analysis from control and snx10ab DKO zebrafish larvae at 3 dpf using MitoSOX reagent. H2O2 was added to the water for 1 h as a positive control. (F) Representative FACS plot showing oxidative stress in control and snx10ab DKO zebrafish larvae at 3 dpf using the MitoSOX reagent. H2O2 added in water served as positive control.
Figure 10.
Figure 10.
Model showing the role of SNX10 as a modulator of endocytic transport and piecemeal mitophagy. In vitro: Under normal conditions (control), SNX10 localizes to early endosomes (RAB5 and EEA1 positive) and late endosomes (CD63 positive) together with endocytic cargo (as EGFR). SNX10-positive structures are also observed near mitochondria. Upon hypoxia-mimicking conditions (induced by DFP or DMOG) SNX10 vesicles co-localize with CD63, LC3B, and p62 and incorporate selected mitochondrial components (including COX-IV), indicating a role for SNX10 in selective mitochondrial degradation. Upon SNX10 knockdown (SNX10 KD), early endosomes appear smaller and more numerous, with a corresponding reduced degradation of EGFR. In contrast, the turnover of mitochondrial COX-IV and ATP synthase is increased, along with reduced oxygen consumption rate and ATP production, reflecting impaired mitochondrial function. The arrow thicknesses indicate the extent of the different pathways under different conditions. In vivo: In zebrafish larvae, Snx10ab DKO leads to decreased levels of mitochondrial proteins (Cox-IV and Samm50), increased levels of ROS, and elevated cell death in the brain region, as shown by TUNEL staining. The snx10ab DKO–mediated cell death can be rescued by treatment with the antioxidant NAC, suggesting that Snx10 modulates piecemeal mitophagy to limit oxidative stress and maintain mitochondrial homeostasis. NAC; N-acetyl cysteine.

References

    1. Abuaita, B.H., Schultz T.L., and O’Riordan M.X.. 2018. Mitochondria-derived vesicles deliver antimicrobial reactive oxygen species to control phagosome-localized Staphylococcus aureus. Cell Host Microbe. 24:625–636.e5. 10.1016/j.chom.2018.10.005 - DOI - PMC - PubMed
    1. Abudu, Y.P., Shrestha B.K., Zhang W., Palara A., Brenne H.B., Larsen K.B., Wolfson D.L., Dumitriu G., Øie C.I., Ahluwalia B.S., et al. . 2021. SAMM50 acts with p62 in piecemeal basal- and OXPHOS-induced mitophagy of SAM and MICOS components. J. Cell Biol. 220:e202009092. 10.1083/jcb.202009092 - DOI - PMC - PubMed
    1. Allen, G.F., Toth R., James J., and Ganley I.G.. 2013. Loss of iron triggers PINK1/Parkin-independent mitophagy. EMBO Rep. 14:1127–1135. 10.1038/embor.2013.168 - DOI - PMC - PubMed
    1. Amirfiroozy, A., Hamidieh A.A., Golchehre Z., Rezamand A., Yahyaei M., Beiranvandi F., Amirfiroozy S., and Keramatipour M.. 2017. A novel mutation in SNX10 gene causes malignant infantile osteopetrosis. Avicenna J. Med. Biotechnol. 9:205–208. - PMC - PubMed
    1. Baechler, B.L., Bloemberg D., and Quadrilatero J.. 2019. Mitophagy regulates mitochondrial network signaling, oxidative stress, and apoptosis during myoblast differentiation. Autophagy. 15:1606–1619. 10.1080/15548627.2019.1591672 - DOI - PMC - PubMed

LinkOut - more resources