. 2025 Dec;30(1):2475696.
doi: 10.1080/13510002.2025.2475696. Epub 2025 Mar 7.

Remimazolam induced cytotoxicity mediated through multiple stress pathways and acted synergistically with tyrosine kinase inhibitors in hepatocellular carcinoma

Affiliations

Remimazolam induced cytotoxicity mediated through multiple stress pathways and acted synergistically with tyrosine kinase inhibitors in hepatocellular carcinoma

Hsiu-Lung Fan et al. Redox Rep. 2025 Dec.

Abstract

The primary treatment for hepatocellular carcinoma (HCC) involves surgical removal of the primary tumor, but this creates a favorable environment for the proliferation and spread of residual and circulating cancer cells. The development of remimazolam-based balanced anesthesia is crucial for future antitumor applications. It is important to understand the mechanisms of cytotoxicity for HCC in detail.

We performed cell viability analysis, western blotting analysis, reverse transcription-polymerase chain reaction analysis, and flow cytometry analysis in two HCC cell lines, HepG2 and Hep3B cells.

Our data demonstrated that remimazolam induced cytotoxicity by suppressing cell proliferation, inhibiting G1 phase progression, and affecting mitochondrial reactive oxygen species (ROS) levels, leading to apoptosis, DNA damage, cytosolic ROS elevation, lipid peroxidation, autophagy, mitochondrial depolarization, and endoplasmic reticulum stress. Inhibitors of apoptosis, autophagic cell death, and ferroptosis and a ROS scavenger failed to rescue cell death caused by remimazolam besylate. Our combination index revealed that remimazolam besylate has the potential to act as a sensitizer for targeted tyrosine kinase inhibitor therapy for HCC.

Our findings open up new possibilities for combinatory HCC therapy using remimazolam, leveraging its dual functional roles in surgery and drug therapy for liver cancers.

Keywords: Cytotoxicity; cell death; drug synergy; mitochondrial dysfunction; reactive oxygen species; remimazolam-based balanced anesthesia; stress; tyrosine kinase inhibitor.


Conflict of interest statement

No potential conflict of interest was reported by the authors.

Figures

None
Graphical abstract
Figure 1.
Figure 1.
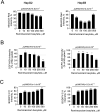
Effects of remimazolam besylate on cell proliferation in HepG2 and Hep3B cells. HepG2 and Hep3B cells were treated with the indicated concentrations of remimazolam besylate for 24 h. (A) Cell metabolic activity was measured using the MTT assay. (B) Cell proliferation was measured using the BrdU cell proliferation analysis. The results are representative of three independent experiments. Symbols and bars depict the mean ± SD. *p < 0.05, **p < 0.01, ***p < 0.001 (Student’s t-tests).
Figure 2.
Figure 2.
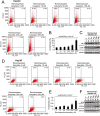
Effects of remimazolam besylate on cell cycle profile and apoptosis in HepG2 and Hep3B cells. HepG2 and Hep3B cells were treated with the indicated concentrations of remimazolam besylate for 24 h. (A) Cell cycle profiles were measured using the flow cytometry analysis with PI staining. (B) Cellular apoptosis was measured using the Annexin V apoptosis analysis with 7-AAD staining. Early apoptotic cells are PE Annexin V-positive and 7-AAD-negative, while late apoptotic cells are both PE Annexin V-positive and 7-AAD-positive. The results (A and B) are representative of three independent experiments. Symbols and bars depict the mean ± SD. *p < 0.05, **p < 0.01, ***p < 0.001 (Student’s t-tests). (C) Cell lysates were subjected to Western blot analysis and (D) RT-PCR analysis. PCNA was the protein loading control and GAPDH was the mRNA loading control. The protein and mRNA bands were quantified through pixel density scanning and evaluated using ImageJ, version 1.44a (http://imagej.nih.gov/ij/). (E) We plotted the ratios of protein to PCNA. (F) We plotted the mRNA/GAPDH ratios.
Figure 3.
Figure 3.
Effects of remimazolam besylate on ROS in HepG2 and Hep3B cells. HepG2 and Hep3B cells were treated with the indicated concentrations of remimazolam besylate for 24 h. They were then subjected to measurement of (A) MitoSOX intensity for mitochondrial ROS, (B) DCFH-DA intensity for cytosol ROS, and (C) BODIPY-C11 intensity for lipid peroxidation. The results are representative of three independent experiments. Symbols and bars depict the mean ± SD. *p < 0.05, **p < 0.01, ***p < 0.001 (Student’s t-tests).
Figure 4.
Figure 4.
Effects of remimazolam besylate on autophagy in HepG2 and Hep3B cells. HepG2 and Hep3B cells were treated with the indicated concentrations of remimazolam besylate for 24 h. Acridine orange (1 µg/mL) staining was used to identify autophagic cells via FACS. (A and D) Acidic vesicular organelles were detected and quantified using acridine orange staining and measured using flow cytometry. (B and E) The intensity of the red fluorescence (y-axis, FL3-H) was proportional to the degree of acidity and the volume of acidic vesicular organelles, including autophagic vacuoles. The values refer to the percentages of cells with a significant proportion of acidic vesicular organelles. The results are representative of three independent experiments. Bars depict the means ± SDs. * p < 0.05; ** p < 0.01 (Student’s t-tests). (C and F) Cell lysates were subjected to Western blot analysis. GAPDH was the protein loading control. The protein bands were quantified through pixel density scanning and evaluated using ImageJ, version 1.44a. We listed the ratios of protein to GAPDH.
Figure 5.
Figure 5.
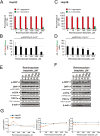
Effects of remimazolam besylate on mitochondrial membrane potential in HepG2 and Hep3B cells. HepG2 and Hep3B cells were treated with the indicated concentrations of remimazolam besylate for 24 h. Mitochondrial membrane potential was assessed using flow cytometry with JC-1 staining. (A and C) The percentages of red and green fluorescence intensities are plotted. (B and D) The red/green fluorescence intensity ratios were measured and are plotted. Bars depict the means ± SDs of three independent experiments. * p < 0.05; ** p < 0.01 (Student’s t-tests). (E and F) Cell lysates were subjected to Western blot analysis. β-actin was the protein loading control. The protein bands were quantified through pixel density scanning and evaluated using ImageJ, version 1.44a. (G) We plotted the ratios of protein to β-actin.
Figure 6.
Figure 6.
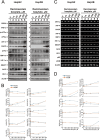
Effects of remimazolam besylate on target proteins and mRNAs in HepG2 and Hep3B cells. HepG2 and Hep3B cells were treated with the indicated concentrations of remimazolam besylate for 24 h. Cell lysates were subjected to (A) Western blot analysis and (C) RT-PCR analysis. ACTN was the protein loading control and β-actin was the mRNA loading control. The protein and mRNA bands were quantified through pixel density scanning and evaluated using ImageJ, version 1.44a (http://imagej.nih.gov/ij/). (B) We plotted the ratios of protein to ACTN. (D) We plotted the mRNA/β-actin ratios.
Figure 7.
Figure 7.
Effects of remimazolam besylate on the signaling pathway in HepG2 and Hep3B cells. (A) HepG2 and Hep3B cells were treated with the indicated concentrations of remimazolam besylate for 24 h. Cell lysates were subjected to Western blot analysis. ACTN was the protein loading control. The protein bands were quantified through pixel density scanning and evaluated using ImageJ, version 1.44a. (B) We plotted the ratios of protein to ACTN and phosphorylated protein to total protein.
Figure 8.
Figure 8.
Combination index of remimazolam besylate with TKIs lenvatinib and regorafenib in HepG2 and Hep3B cells. HepG2 and Hep3B cells were treated with remimazolam besylate dose: 0, 3.125, 6.25, 12.5, 25, 50, 100, 200, 400, 800 µM combined with (A and B) lenvatinib dose: 0, 2.5, 5, 10, 20, 40, 80, 160 μM or (C and D) regorafenib dose: 0, 2.5, 5, 10, 20, 40, 80, 160 μM. Cell viability was measured using the MTT method. The combination index of remimazolam besylate plus (B) lenvatinib or (D) regorafenib. Isobolograms (ED50) of remimazolam plus lenvatinib or regorafenib were calculated from three independent experiments (red, blue, and green dots and lines) using CalcuSyn software (black dots and lines).
Figure 9.
Figure 9.
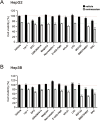
The ability of various cell death inhibitors to rescue remimazolam besylate-mediated cytotoxicity in HepG2 and Hep3B cells. (A) HepG2 and (B) Hep3B cells were pre-treated for 1 h with indicated inhibitors, including 2 µM Lip-1, 100 µM DFO, 4 µM GSK260414, 5 µM Meglutol, 40 µM Necrostatin-1, 40 µM Z-VAD-FMK, 10 mM NH4Cl, 10 mM LiCl, 0.1 µM MG132, 0.1 µM BMS754807, and 10 mM NAC, and combined with vehicle or 400 μM remimazolam besylate for 24 h. Cell viability was measured using the MTT method. Bars depict the means ± SDs of three independent experiments. * p < 0.05; ** p < 0.01; *** p < 0.001 (Student’s t-tests). The dashed red line is the level for the vehicle control, and the dashed green line is the level for the remimazolam besylate alone.

References

    1. Lee B, Kim MH, Kong HJ, et al. . Effects of remimazolam vs. sevoflurane anesthesia on intraoperative hemodynamics in patients with gastric cancer undergoing robotic gastrectomy: A propensity score-matched analysis. J Clin Med. 2022;11(9):2643. doi:10.3390/jcm11092643 - DOI - PMC - PubMed
    1. Ko CC, Hung KC, Illias AM, et al. . The use of remimazolam versus propofol for induction and maintenance of general anesthesia: A systematic review and meta-analysis. Front Pharmacol. 2023;14:1101728. doi:10.3389/fphar.2023.1101728 - DOI - PMC - PubMed
    1. Kuang Q, Zhong N, Ye C, et al. . Propofol versus remimazolam on cognitive function, hemodynamics, and oxygenation during one-lung ventilation in older patients undergoing pulmonary lobectomy: A randomized controlled trial. J Cardiothorac Vasc Anesth. 2023;37(10):1996–2005. doi:10.1053/j.jvca.2023.06.027 - DOI - PubMed
    1. Zhao SY, Lu XH, Lyu SG, et al. . Effects of remimazolam versus propofol on postoperative recovery quality in elderly patients undergoing thoracoscopic laparoscopic radical esophagectomy. Zhonghua Yi Xue Za Zhi. 2023;103(17):1303–1309. doi:10.3760/cma.j.cn112137-20221121-02449 - DOI - PubMed
    1. Lee J, Kim DH, Ju JW, et al. . Comparison of recovery profiles between total intravenous anaesthesia with propofol or remimazolam reversed with flumazenil in patients undergoing breast surgery: A randomised controlled trial. Eur J Anaesthesiol. 2024;41(3):199–207. doi:10.1097/EJA.0000000000001951 - DOI - PubMed

MeSH terms