. 2025 Jun 2;85(11):2117-2133.
doi: 10.1158/0008-5472.CAN-24-2697.

Combining Apatinib and Oxaliplatin Remodels the Immunosuppressive Tumor Microenvironment and Sensitizes Desert-Type Gastric Cancer to Immunotherapy

Affiliations

Combining Apatinib and Oxaliplatin Remodels the Immunosuppressive Tumor Microenvironment and Sensitizes Desert-Type Gastric Cancer to Immunotherapy

Guang-Tan Lin et al. Cancer Res. .

Abstract

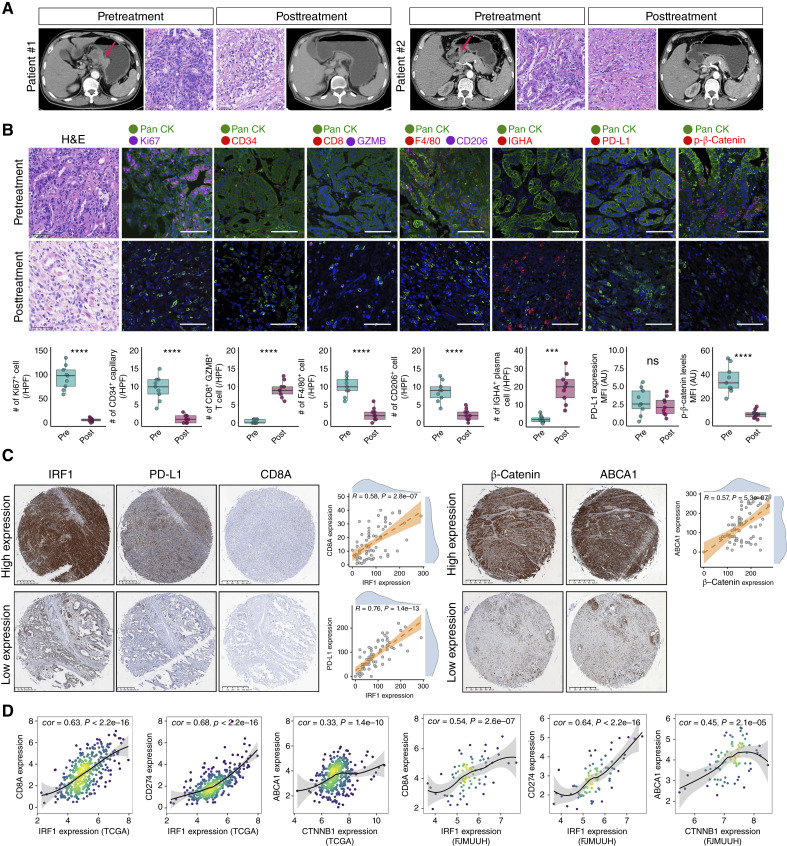
Immune checkpoint blockade (ICB) therapies have achieved significant breakthroughs in cancer treatment over the past decade. However, ICB is largely ineffective in desert-type gastric cancer due to intrinsic tumor heterogeneity and a highly immunosuppressive tumor microenvironment (TME). Transforming tumors from an immunosuppressive state to an immunostimulatory state is a potential approach to enhance ICB response. In this study, we developed a chromosomal instability-subtype gastric cancer mouse model with an immunoactive TME and a stem cell-originated mouse-derived allograft model with an immunosuppressed TME to investigate mechanisms regulating the tumor immunophenotype and uncover therapeutic strategies to remodel the TME. Blocking β-catenin signaling attenuated the immunochemotherapeutic resistance of mouse-derived allograft tumors. The tyrosine kinase inhibitor apatinib reprogrammed the TME by increasing CD8+ T-cell and IGHA+ plasma cell infiltration and decreasing M2 macrophages, but apatinib also induced PD-L1 and CD80 expression in both human and mouse desert-type tumors. Oxaliplatin decreased the apatinib-induced expression of immune checkpoints and enhanced the antitumor efficacy of immunotherapy. A prospective clinical trial (NCT04195828) demonstrated that a neoadjuvant regimen of apatinib plus ICB and chemotherapy was effective in patients with desert-type gastric cancer. Collectively, these findings identify potential drug targets for immune desert-type gastric cancer driven by β-catenin signaling. Significance: Apatinib combined with oxaliplatin reprograms the tumor immune microenvironment in desert-type gastric cancer, enhancing the efficacy of immune checkpoint blockade and paving the way for optimized combination immunotherapeutic strategies.


Conflict of interest statement

No disclosures were reported.

Figures

None
Graphical abstract
Figure 1.
Figure 1.
A transgenic mouse model and MDAs of gastric cancer. A, Kaplan–Meier survival analysis for patients with different TCGA subtypes in TCGA gastric cancer cohorts. B, Immunotherapeutic response rate among TCGA subtypes in the ENA cohort. CR, complete response; GC, gastric cancer; PD, progressive disease; PR, partial response; SD, stable disease. C, Relative IC50 was predicted among TCGA subtypes for samples from TCGA and ENA cohort via the oncoPredict package in R software. D, Schematic diagram of the transgenic mouse model (APTc) and MDAs of gastric cancer. E, IF staining for Pan CK (cytokeratin; green) and APC/P53 (red) was performed on the APTc tumors and MDA tumors. Scale bars, 100 μm. F, Representative hematoxylin and eosin (H&E) and IHC staining of PHH3 and Ki67 expression in the APTc and MDA models. Scale bars, 50 μm. G, Representative IHC staining of synaptophysin and CD56 expression in the APTc and MDA models. Five samples per group. Scale bars, 50 μm. H, Quantification of nucleoplasmic ratio, PHH3, and Ki67 expression in the APTc and MDA models. Five samples per group. ANOVA was used to compare the means of ≥3 treatment groups. In all panels, ns, not significant; *, P < 0.05; **, P < 0.01; ****, P < 0.0001. D, Created in BioRender. Lin, G. (2025) https://BioRender.com/q27k073.
Figure 2.
Figure 2.
A single-cell transcriptome atlas dissecting the heterogeneity of APTc and MDA tumors. A, Schematic diagram of the scRNA-seq process and experimental validation. Three APTc (APC-driven transgenic mouse model) tumors and three orthotopic MDA tumors were included. B, Uniform Manifold Approximation and Projection (UMAP) distinguished seven main cell types in our scRNA-seq data. C, Proportions of each sample in the seven cell types. D, Proportion of each cell type in the six samples. E, UMAP recognized 14 main cell clusters from 36,511 epithelial cells. F, Epithelial cells were identified as normal and tumor cells according to the CNV score. G, Violin plot showing the CNV score among normal, APTc, and MDA tumor cells. H, IF staining (scale bars, 100 μm) and quantification for β-catenin (red) were performed on human (inflamed-type/desert-type) and mouse (APTc/MDA-S) gastric cancer tumors. Nine fields in three samples per group. AU, arbitrary units. I, Organoids derived from MDA with knockdown of β-catenin displaying significantly smaller spheroids when compared with control (CTRL). Representative images of IF staining of β-catenin, Ki67, and stemness maker (SOX2, AXIN2, and LGR5) expression under indicated conditions. N = 3 per group. A Student t test was applied for evaluating the significance of the difference between the two groups. ****, P < 0.0001. A, Created in BioRender. Lin, G. (2025) https://BioRender.com/i12t455.
Figure 3.
Figure 3.
MDA tumor presents an immunosuppressive desert-type microenvironment. A, Uniform Manifold Approximation and Projection (UMAP) identifying three CD8+ T and four CD4+ T-cell lineages. B, The expression of immune checkpoints in cytotoxic CD8+ T cells. C, UMAP showing the coexpression of CD8a and immune checkpoints (Gzma, Gzmb, and Pdcd1) in CD8_T_CTL clusters. D, IF staining (scale bars, 100 μm) and quantification for CD8/PD-L1 (red) and granzyme B (GZMB; purple) were performed on mouse (APTc/MDA-S) and human (inflamed-type/desert-type) gastric cancer tumors. Nine fields in three samples per group. AU, arbitrary units. E, Gene expression profiles of cytotoxic T lymphocyte (CTL), antigen presentation machinery (APM), and immune checkpoints in mouse bulk sequence data and TCGA gastic cancer cohort. F, UMAP classifying five myeloid cell lineages. G, The proportion of all myeloid cell clusters among APTc and MDA-S tumors. H, Frequencies of correlative markers across myeloid cell clusters. I, IF staining (scale bars, 100 μm) and quantification for CD206 (green) and F4/80 (red) was performed on the mouse gastric cancer tumors. Nine fields in three samples per group. A Student t test was utilized to evaluate the significance of the difference between the two groups. ***, P < 0.001; ****, P < 0.0001.
Figure 4.
Figure 4.
The therapeutic resistances of MDA tumors were abrogated by β-catenin signaling blockade. A, Schematic diagram for chemotherapy and immunotherapy in the APTc (APC-driven transgenic mouse model) model. B, Representative morphology of the stomach. Scale bars, 1 cm. Hematoxylina and eosin (H&E) and IF staining of PHH3, Ki67, CD8, and granzyme B (GZMB) expression in the APTc models. Seven samples per group. Scale bars, 100 μm. C, Quantification of PHH3, Ki67, CD8, and granzyme B expression presented in B. Nine fields in three samples per group. D, Schematic diagram for chemotherapy and immunotherapy in the subcutaneous MDA of C57BL/6 models (MDA-C). Six samples per group. E, Left, tumor growth as a function of time for each group. Data are presented as mean ± SD. Right, TVs at the end of the injection of indicated reagents. F, Representative hematoxylin and eosin and IF staining of PHH3, Ki67, CD34, and CD8 expression in the MDA model. Scale bars, 100 μm. G, Quantification of PHH3, Ki67, CD34, and CD8 expression presented in F. Nine fields in three samples per group. H, Western blotting of β-catenin, phosphorylated (p)-β-catenin (S552), ABCA1, and ABCC9 was performed on gastric cancer cell lines under indicated conditions. I, Schematic diagram for drug administration in the MDA-C model. J, Left, tumor growth as a function of time for each group. Data are presented as mean ± SD. Right, TVs at the end of treatment. Six samples per group. Oxa, oxaliplatin. K, Western blotting of p-β-catenin (S552), β-catenin, ABCA1, and ABCC9 was performed on the MDA-C tumors with and without MSAB treatment. A Student t test was applied to evaluate the significance of the difference between the two groups. ns, not significant; *, P < 0.05; **, P < 0.01; ***, P < 0.001; ****, P < 0.0001. A, Created in BioRender. Lin, G. (2025) https://BioRender.com/d65c558; D, Created in BioRender. Lin, G. (2025) https://BioRender.com/z80v148; I, Created in BioRender. Lin, G. (2025) https://BioRender.com/b42r260.
Figure 5.
Figure 5.
Apatinib promotes CD8+ T lymphocyte infiltration and reshapes the TME in desert-type gastric cancer. A, Schematic diagram for apatinib administration in the MDA-C model. B, Tumor growth as a function of time for each group. C, Western blotting of phosphorylated (p)-β-catenin (S552), β-catenin, ABCA1, and ABCC9 was performed in the MDA tumors with/without apatinib administration. D, Representative hematoxylin and eosin (H&E) and IF staining (scale bars, 100 μm) and quantification of p-β-catenin, Ki67, CD8, granzyme B (GZMB), CD206, F4/80 (marker for macrophages), and IGHA expression in the MDA models. Nine fields in three samples per group. AU, arbitrary units; CK, cytokeratin. E, qRT-PCR (three independent experiments) of C-X-C motif chemokine ligand 9 (CXCL9) in HGC-27, with indicated conditions. F, Intracellular and secreted expression of CXCL9 in HGC-27 and MKN28 cells, with indicated conditions. G, IF staining of Pan CK and CXCL9 expression in the MDA models with/without apatinib administration. Scale bars, 100 μm. H, Chemotaxis assay of CD8+ T cells, isolated from peripheral blood mononuclear cells, toward tumor cells. HGC-27 and MKN28 cells were pretreated with apatinib or incubated with human recombinant CXCL9 protein or C-X-C chemokine receptor type 3 (CXCR3) neutralization antibody. Five independent experiments. A Student t test was used to evaluate the significance of the difference between the two groups. *, P < 0.05; **, P < 0.01; ***, P < 0.001; ****, P < 0.0001. A, Created in BioRender. Lin, G. (2025) https://BioRender.com/a33c522.
Figure 6.
Figure 6.
Oxaliplatin enhances the antitumor efficacy of apatinib via abrogating targeted therapy–induced PD-L1 expression. A, IF staining of Pan cytokeratin (CK), CD8, and granzyme B (GZMB) expression in the MDA tumors with/without apatinib treatment. Scale bars, 100 μm. B, Western blotting of STAT1/IRF1 signaling was performed in HGC-27 cells under indicated treatments. C, Western blotting of STAT1/IRF1 signaling was performed in HGC-27 and MKN28 cells under indicated treatments. D, Analysis of PD-L1 and CD80 wild-type (WT) or mutant promoter activity in HGC-27 cells treated with apatinib. Three independent experiments. E, IF staining of PD-L1 and CD80 in the MDA model. AU, arbitrary units. Scale bars, 100 μm. F and G, Western blotting and qRT-PCR (three independent experiments) of STAT1/IRF1 signaling were performed in HGC-27 and MKN28 cells under indicated treatments. H, Schematic diagram for drug administration in the MDA model (left) and tumor growth presented as a function of time in the MDA model (right). Six samples per group. I, The subcutaneous MDA models in Figs. 4D, 5A, and H were integrated by normalizing the TV of the control (CTRL) group to 100%. Synergistic effects were assessed based on the tumor suppression rate. J, Representative hematxoylin and eosin (H&E) and IF staining (scale bars, 100 μm) and quantification of CD8, granzyme B, CD206 (macrophage marker), F4/80 (marker for macrophages), and PD-L1 expression in MDA models. Nine fields in three samples per group. A Student t test was utilized to evaluate the significance of the difference between the two groups. ns, not significant; *, P < 0.05; **, P < 0.01; ***, P < 0.001; ****, P < 0.0001. Apa, apatinib; Oxa, oxaliplatin. H, Created in BioRender. Lin, G. (2025) https://BioRender.com/m22f788.
Figure 7.
Figure 7.
Neoadjuvant regimen of apatinib plus camrelizumab and chemotherapy is effective for patients with desert-type gastric cancer. A, Representative images of CT scan and hematoxylin and eosin staining for two patients receiving the neoadjuvant regimen. The tumor site was annotated by the radiologist with a red arrow. B, IF staining (scale bars, 100 μm) and quantification of Ki67, CD34, cytotoxic T-cell marker/granzyme B (CD8/GZMB), CD206/F4/80, IGHA, PD-L1, and phosphorylated (p)-β-catenin in pre- and posttreatment human gastric cancer samples. Nine fields in three samples per group. A Student t test was utilized to evaluate the significance of the difference between the two groups. AU, arbitrary units; CD34, marker for endothelial cells. C, Representative IHC staining and correlation among IRF1, PD-L1, CD8A, β-catenin, and ABCA1 expression in a TMA cohort comprising 66 gastric cancer samples. D, Pearson correlation analysis for IRF1, PD-L1, CD8A, β-catenin, and ABCA1 expression in TCGA and FJMUUH cohorts. ns, not significant; ***, P < 0.001; ****, P < 0.0001.

References

    1. Bray F, Laversanne M, Sung H, Ferlay J, Siegel RL, Soerjomataram I, et al. . Global cancer statistics 2022: GLOBOCAN estimates of incidence and mortality worldwide for 36 cancers in 185 countries. CA Cancer J Clin 2024;74:229–63. - PubMed
    1. He Y, Wang Y, Luan F, Yu Z, Feng H, Chen B, et al. . Chinese and global burdens of gastric cancer from 1990 to 2019. Cancer Med 2021;10:3461–73. - PMC - PubMed
    1. Wang Y, Lei X, Liu Z, Shan F, Ying X, Li Z, et al. . Short-term outcomes of laparoscopic versus open total gastrectomy after neoadjuvant chemotherapy: a cohort study using the propensity score matching method. J Gastrointest Oncol 2021;12:237–48. - PMC - PubMed
    1. Lauren P. The two histological main types of gastric carcinoma: diffuse and So-called intestinal-type carcinoma. An attempt at a histo-clinical classification. Acta Pathol Microbiol Scand 1965;64:31–49. - PubMed
    1. Cancer Genome Atlas Research Network . Comprehensive molecular characterization of gastric adenocarcinoma. Nature 2014;513:202–9. - PMC - PubMed

MeSH terms