Comparative Study
. 2025 Mar 7;21(3):e1012859.
doi: 10.1371/journal.pcbi.1012859. eCollection 2025 Mar.

Penalised regression improves imputation of cell-type specific expression using RNA-seq data from mixed cell populations compared to domain-specific methods

Affiliations
Comparative Study

Penalised regression improves imputation of cell-type specific expression using RNA-seq data from mixed cell populations compared to domain-specific methods

Wei-Yu Lin et al. PLoS Comput Biol. .

Abstract

Gene expression studies often use bulk RNA sequencing of mixed cell populations because single cell or sorted cell sequencing may be prohibitively expensive. However, mixed cell studies may miss expression patterns that are restricted to specific cell populations. Computational deconvolution can be used to estimate cell fractions from bulk expression data and infer average cell-type expression in a set of samples (e.g., cases or controls), but imputing sample-level cell-type expression is required for more detailed analyses, such as relating expression to quantitative traits, and is less commonly addressed. Here, we assessed the accuracy of imputing sample-level cell-type expression using a real dataset where mixed peripheral blood mononuclear cells (PBMC) and sorted (CD4, CD8, CD14, CD19) RNA sequencing data were generated from the same subjects (N=158), and pseudobulk datasets synthesised from eQTLgen single cell RNA-seq data. We compared three domain-specific methods, CIBERSORTx, bMIND and debCAM/swCAM, and two cross-domain machine learning methods, multiple response LASSO and ridge, that had not been used for this task before. We also assessed the methods according to their ability to recover differential gene expression (DGE) results. LASSO/ridge showed higher sensitivity but lower specificity for recovering DGE signals seen in observed data compared to deconvolution methods, although LASSO/ridge had higher area under curves than deconvolution methods. Machine learning methods have the potential to outperform domain-specific methods when suitable training data are available.


Conflict of interest statement

I have read the journal’s policy and the authors of this manuscript have the following competing interests: The CLUSTER consortium has been provided with generous grants from AbbVie and Sobi. CW receives funding from MSD and GSK and is a part-time employee of GSK. These companies had no involvement in the work presented here.

Figures

Fig 1
Fig 1. Multi-response LASSO/ridge models for predicting sample-level cell-type expression.
We utilised gene expression data from pure cell types (such as CD4, CD8, CD14, and CD19) and a mixed cell type (such as PBMC), all obtained from the same subjects as our training data. For each cell type, we clustered genes with similar expression into chunks. For each chunk, we learned the expression associations between cell-type-specific target genes and predictor genes in PBMC using a multi-response LASSO/ridge model with five-fold cross-validation. The multi-response model includes a group penalty so that regression coefficients β for any given predictor may be shrunk to zero for all target genes. The non-zero β take different values corresponding to each target gene. This multi-response LASSO/ridge model was then employed to predict the expression of cell-type-specific target genes in testing samples based on their PBMC expression. The learning and prediction steps were repeated for all gene chunks for each cell type, and the predicted target gene expression was assembled on a per-cell type basis.
Fig 2
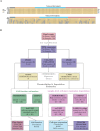
Fig 2. Data and study design.
(A) CLUSTER samples by cell type (row) and subject (column). Cells are coloured based on the availability of RNA (Y for yes, N for no), and the top panel annotations indicate the RNA sequencing batch (Batch) (B) Data analysis workflow. Transcripts per million (TPM) were calculated after excluding low-expressed genes. TPM from sorted cells (CD4, CD8, CD14, and CD19) from 80 training samples were used to generate custom signature genes using the CIBERSORTxFractions module. We deconvoluted the cell fractions from PBMC based on inbuilt and custom signatures using CIBERSORTx, using the custom signature genes with bMIND and cell-type specific genes using debCAM. Estimates of cell fractions were compared to the ground-truth cell fractions from flow cytometry, and we assessed fraction accuracy using Pearson correlation and RMSE (root mean square error). Next, we estimated sample-level cell-type gene expression based on inbuilt and custom signature matrices using the CIBERSORTx high resolution module. In parallel, we ran bMIND and swCAM, with the flow cytometry cell fractions, in a supervised mode for estimating cell-type expression. For each cell type, we trained a LASSO/ridge model on PBMC and sorted cells with 5-fold cross-validation and used this to predict cell-type gene expression in the test samples. We compared imputed cell-type expressions with the observed ones and evaluated and benchmarked the performance using Pearson correlation, RMSE and a novel measure, differential gene expression (DGE) recovery.
Fig 3
Fig 3. Prediction accuracy of cell fractions by cell type (column) and approaches (row).
Pearson correlation (R) and root mean square errors (RMSE) were calculated between estimated fractions (y-axis) and flow cytometry measures (x-axis). Each point is a testing sample and dashed blue lines indicate y = x. CIBX-inbuilt: CIBERSORTx fraction deconvolution using the inbuilt signature matrix; CIBX-custom: CIBERSORTx fraction deconvolution using the custom signature matrix; bMIND-custom: bMIND fraction estimation using the custom signature matrix; debCAM-custom: debCAM fraction estimation using cell-type specific genes.
Fig 4
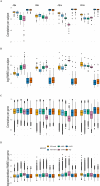
Fig 4. Prediction accuracy of sample-level cell-type expression by approach.
(A) Pearson correlation and (B) log root mean square error (RMSE) comparing observed to predicted cell-type expression of genes from the same subjects, one estimate per subject. (C) Pearson correlation and (D) log RMSE between observed and predicted cell-type expression across testing samples for each gene, one estimate per gene. RMSE was standardised by the average observed expression per gene. CIBX-inbuilt: CIBERSORTx expression deconvolution with the inbuilt signature matrix; CIBX-custom: CIBERSORTx expression deconvolution with a custom signature matrix derived from sorted cell-type expression in training samples; bMIND: bMIND expression deconvolution with flow fractions; swCAM: swCAM deconvolution with flow fractions; LASSO/ridge: expression predicted from regularised multi-response Gaussian models.
Fig 5
Fig 5. Differential gene expression (DGE) recovery based on CLUSTER data.
Area under curve (AUC) distributions estimated in held out test data by approach and cell type (columns) for each scenario (rows). Scenarios differed in simulated dichotomous (dichPheno)/ continuous (contPheno) phenotypes, with/without sex as a covariate in the DGE models. dichPheno: dichotomous phenotype; dichPheno+sex: simulated dichotomous phenotype and sex; contPheno: continuous phenotype; contPheno+sex: continuous phenotype and sex. Each point is a simulated phenotype, and there are ten simulated phenotypes. For each simulated phenotype, the receiver operating characteristic curve and AUC were estimated by FDR fixed at 0.05 in the observed data and varied FDRs from 0 to 1 by 0.05 in the imputed data. Box plots showed the AUC distributions, with horizontal lines from the bottom to the top for 25%, 50% and 75% quantiles, respectively. CIBX-inbuilt: CIBERSORTx with the inbuilt signature matrix; CIBX-custom: CIBERSORTx with a custom signature matrix; bMIND: bMIND with flow fractions; swCAM: swCAM with flow fractions; LASSO/ridge: regularised multi-response Gaussian models.
Fig 6
Fig 6. Differential gene expression (DGE) recovery based on pseudobulk data.
We varied training sample size from 20 (25%) to 80 (100%) (x-axis) and quantified area under curve (AUC) in held out test data for DGE recovery (y-axis) by cell type (columns) for each scenario (rows). cond: raw aggregated read counts were used for DGE analysis of in vitro stimulation with C. albicans after 3 hours (3hCA) vs untreated (UT). batch+cond: same as cond, and with batch (V2 & V3 chemistry) as a covariate in the 3hCA vs UT DGE model. Combat-seq cond: Combat-seq batch-corrected read counts were used in DGE analysis of 3hCA vs UT. Each point is the result of one analysis, and three replicates were conducted for each training sample size. For each pseudobulk data, the receiver operating characteristic curve and AUC were estimated by FDR fixed at 0.05 in the observed DGE results and varied FDRs from 0 to 1 by 0.05 in the DGE results using imputed expression. Local polynomial regression fitting (loess) were plotted for each approach. Note that CIBX-inbuilt is not shown for CD19/Combat-Seq cond. This is because it was able to impute < 60 genes, compared to ∼ 1,000 for CIBX-custom and > 11,000 for other methods, so estimates of AUC are very noisy. CIBX-inbuilt: CIBERSORTx with the inbuilt signature matrix; CIBX-custom: CIBERSORTx with a custom signature matrix based on pure cell expression in the training samples; bMIND: bMIND with true fractions; swCAM: swCAM with true fractions; LASSO/ridge: regularised multi-response Gaussian models.

References

    1. Lee JC, Lyons PA, McKinney EF, Sowerby JM, Carr EJ, Bredin F, et al.. Gene expression profiling of CD8+ T cells predicts prognosis in patients with Crohn disease and ulcerative colitis. J Clin Invest. 2011;121(10):4170–9. doi: 10.1172/JCI59255 - DOI - PMC - PubMed
    1. McKinney EF, Lyons PA, Carr EJ, Hollis JL, Jayne DRW, Willcocks LC, et al.. A CD8+ T cell transcription signature predicts prognosis in autoimmune disease. Nat Med. 2010;16(5):586–91. doi: 10.1038/nm.2130 - DOI - PMC - PubMed
    1. Lyons PA, McKinney EF, Rayner TF, Hatton A, Woffendin HB, Koukoulaki M, et al.. Novel expression signatures identified by transcriptional analysis of separated leucocyte subsets in systemic lupus erythematosus and vasculitis. Ann Rheum Dis. 2010;69(6):1208–13. doi: 10.1136/ard.2009.108043 - DOI - PMC - PubMed
    1. McKinney EF, Lee JC, Jayne DRW, Lyons PA, Smith KGC. T-cell exhaustion, co-stimulation and clinical outcome in autoimmunity and infection. Nature. 2015;523(7562):612–6. doi: 10.1038/nature14468 - DOI - PMC - PubMed
    1. Sturm G, Finotello F, List M. In Silico Cell-Type Deconvolution Methods in Cancer Immunotherapy. In: Boegel S, editor. Bioinformatics for Cancer Immunotherapy. Methods in Molecular Biology. New York: Humana Press; 2020. p. 213–22. doi: 10.1007/978-1-0716-0327-7_15 - DOI - PubMed

Publication types

MeSH terms

LinkOut - more resources