

Recombinant inbred line panels inform the genetic architecture and interactions of adaptive traits in Drosophila melanogaster
- PMID: 40053834
- PMCID: PMC12060232
- DOI: 10.1093/g3journal/jkaf051
Recombinant inbred line panels inform the genetic architecture and interactions of adaptive traits in Drosophila melanogaster
Abstract
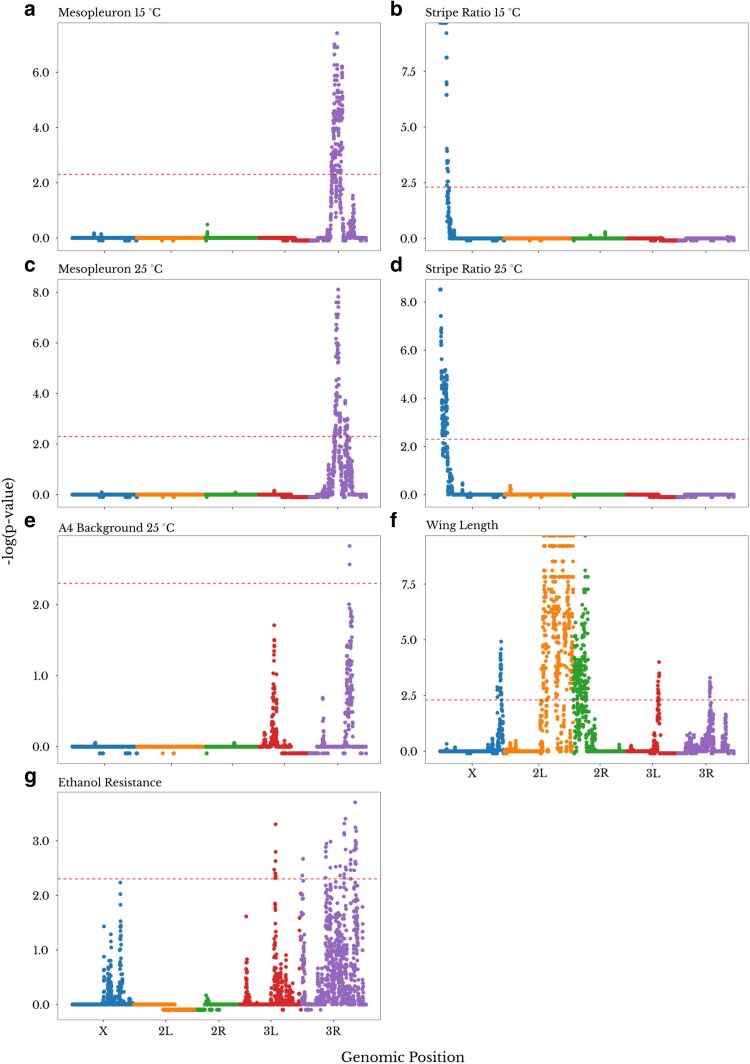
The distribution of allelic effects on traits, along with their gene-by-gene and gene-by-environment interactions, contributes to the phenotypes available for selection and the trajectories of adaptive variants. Nonetheless, uncertainty persists regarding the effect sizes underlying adaptations and the importance of genetic interactions. Herein, we aimed to investigate the genetic architecture and the epistatic and environmental interactions involving loci that contribute to multiple adaptive traits using 2 new panels of Drosophila melanogaster recombinant inbred lines (RILs). To better fit our data, we re-implemented functions from R/qtl using additive genetic models. We found 14 quantitative trait loci (QTLs) underlying melanism, wing size, song pattern, and ethanol resistance. By combining our mapping results with population genetic statistics, we identified potential new genes related to these traits. None of the detected QTLs showed clear evidence of epistasis, and our power analysis indicated that we should have seen at least 1 significant interaction if sign epistasis or strong positive epistasis played a pervasive role in trait evolution. In contrast, we did find roles for gene-by-environment interactions involving pigmentation traits. Overall, our data suggest that the genetic architecture of adaptive traits often involves alleles of detectable effect, that strong epistasis does not always play a role in adaptation, and that environmental interactions can modulate the effect size of adaptive alleles.
Keywords: Drosophila melanogaster; FlyBase; adaptation; epistasis; quantitative genetics; quantitative trait loci (QTLs).
© The Author(s) 2025. Published by Oxford University Press on behalf of The Genetics Society of America.
Conflict of interest statement
Conflicts of interest: The author(s) declare no conflict of interest.
Figures


Update of
-
Recombinant inbred line panels inform the genetic architecture and interactions of adaptive traits in Drosophila melanogaster.bioRxiv [Preprint]. 2025 Feb 24:2024.05.14.594228. doi: 10.1101/2024.05.14.594228. bioRxiv. 2025. Update in: G3 (Bethesda). 2025 May 8;15(5):jkaf051. doi: 10.1093/g3journal/jkaf051. PMID: 38798433 Free PMC article. Updated. Preprint.
References
-
- Abramoff MD, Magalhães PJ, Ram SJ. 2004. Image processing with ImageJ. Biophotonics Intern. 11(7):36–42.
-
- Arthur BJ, Ding Y, Sosale M, Khalif F, Kim E, Waddell P, Turaga SC, Stern DL. 2021. SongExplorer: a deep learning workflow for discovery and segmentation of animal acoustic communication signals. bioRxiv 437280. 10.1101/2021.03.26.437280, preprint: not peer reviewed. - DOI
MeSH terms
Grants and funding
LinkOut - more resources
Full Text Sources
Molecular Biology Databases