. 2025 May 8;15(5):jkaf050.
doi: 10.1093/g3journal/jkaf050.

Courtship song differs between African and European populations of Drosophila melanogaster and involves a strong effect locus

Affiliations

Courtship song differs between African and European populations of Drosophila melanogaster and involves a strong effect locus

Matthew J Lollar et al. G3 (Bethesda). .

Abstract

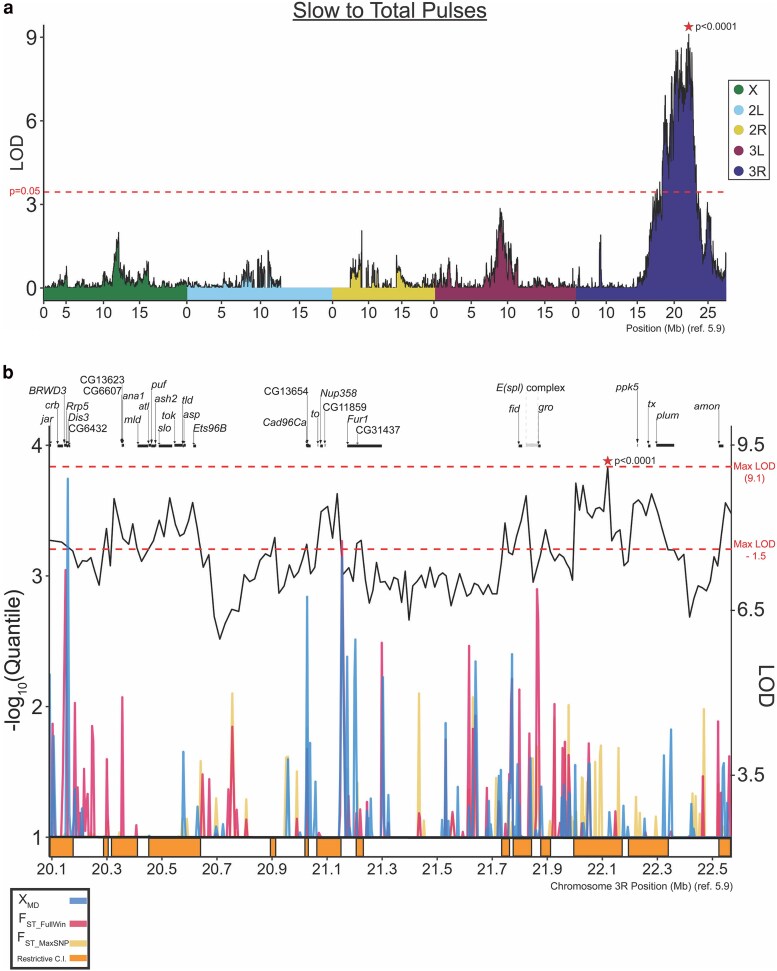
The courtship song of Drosophila melanogaster has long served as an excellent model system for studies of animal communication and differences in courtship song have been demonstrated among populations and between species. Here, we report that flies of African and European origin, which diverged ∼13,000 years ago, show significant genetic differentiation in the use of slow vs fast pulse song. Using a combination of quantitative trait mapping and population genetic analysis, we detected a single strong quantitative trait locus underlying this trait and we identified candidate genes that may contribute to the evolution of this trait. Song trait variation between parental strains of our recombinant inbred panel enabled detection of genomic intervals associated with 6 additional song traits, some of which include known courtship-related genes. These findings improve the prospects for further genetic insights into the evolution of reproductive behavior and the biology underlying courtship song.

Keywords: QTL mapping; behavior; courtship song; evolution; flyBase; variation.


Conflict of interest statement

Conflicts of interest: The authors declare that they have no conflicts of interest.

Figures

Fig. 1.
Fig. 1.
Correlation analysis between traits mapped from male song recordings reveals several positively and negatively correlated traits. a) Correlations among inbred strains, divided by population (France bottom-left, Zambia top-right). b) Correlations among RILs. In all data sets, the strongest positive correlation was between pulse and sine amplitude traits. Circle size indicates the relative strength of significance in Pearson's (r) covariance between traits, where the presence of a circle indicates minimally a P-value of P < 0.05, and correlations with an estimated multiple-testing corrected significant P-values of P < 1.0 × 10⁻³, P < 1.0 × 10⁻⁶, and P < 1.0 × 10⁻⁹ are denoted with asterisks (*, **, and ***, respectively).
Fig. 2.
Fig. 2.
Zambia and France D. melanogaster males display differences in pulse mode preference (slow to total pulses) and in pulse amplitude. Violin and boxplots for France and Zambia males are displayed, with the middle line in boxplots representing median values, and inbred strains ordered by those median values. Parental strains used in the establishment of the RIL panel are highlighted by dotted boxes. The pairwise differences in both traits between parental strains are of similar magnitude and direction to that of the population trend, suggesting that some of the genetic variation contributing to phenotypic differences between populations may be represented among the RIL panel.
Fig. 3.
Fig. 3.
Traits associated with the amount and type of song map to unique QTLs. The number of bouts per minute (a) mapped to a pair of nearby QTLs on the X chromosome—the only X-linked QTLs detected in this study. The probability of initiating sine song (“Null to Sine”) (b) and the median length of pulse trains (c) mapped to single QTLs. In contrast, the median length of sine trains displayed a more polygenic basis, with multiple QTLs across both arms of chromosome 3, and distinct peaks from the pulse song counterpart of this trait (d). LOD values are plotted against D. melanogaster genome (release 5.9) positions, where color denotes chromosome arm. Genome-wide significance thresholds of LOD values corresponding to P = 0.05 for each scan are displayed as dashed lines. Significant peaks are denoted with a star, with P-values noted. Further characteristics of each QTL are given in Supplementary Table 7.
Fig. 4.
Fig. 4.
Traits associated with sine and pulse song qualities map to unique autosomal QTLs. Both pulse (a) and sine (b) song amplitude and carrier frequencies were distinct between RIL parental strains, and map to unique QTLs. The only instance of partially overlapping QTL peaks was a region on chromosome 3R, overlapping QTLs for pulse amplitude (c) and sine train length (d), while the QTL for pulse carrier frequency was nearby, as was the nearly significant peak for sine amplitude. LOD values are plotted against D. melanogaster genome (release 5.9) positions, where color denotes chromosome arm. Genome-wide significance thresholds of LOD values corresponding to P = 0.05 are displayed as dashed lines. Significant peaks are denoted with a star, with P-values noted. Further characteristics of each QTL are given in Supplementary Table 7.
Fig. 5.
Fig. 5.
Pulse mode preference maps to a single strong effect QTL, with potentially relevant genes indicated by functional annotation and population genetic analysis. a) QTL mapping of the quantitative trait “slow to total pulses” in song reveals a single strong QTL on chromosome 3R with a complex LOD landscape. All features of this plot are as described for Figs. 3 and 4. b) Negative log quantile values for FST_FullWin, FST_MaxSNP, and χMD (see legend) reveal genomic regions with elevated population differentiation quantile values, sometimes overlapping peak LOD windows. -log10 quantile values on the left y-axis begin at 1.00 to better visualize outlier windows. Window LOD scores are represented as a black line (right y-axis). Restrictive CIs are represented as shaded boxes under the x-axis. The QTL peak's maximum LOD score and the (MaxLOD—1.5) threshold are displayed as dashed red lines across the y-axis, with the latter value representing a threshold for restrictive Ci inclusion. We find an aggregation of more differentiated genomic sites within restrictive QTLs around 3R:21.75–22.25 Mb. This genomic region has been previously implicated in courtship behavior (Moehring and Mackay 2004). Further gene annotation details are available in Supplementary Table 8.

Update of

References

    1. Gene Ontology Consortium; Aleksander SA, Balhoff J, Carbon S, Cherry JM, Drabkin HJ, Ebert D, Feuermann M, Gaudet P, Harris NL, et al. 2023. The gene ontology knowledgebase in 2023. Genetics. 224(1):iyad031. doi:10.1093/genetics/iyad031. - DOI - PMC - PubMed
    1. Anholt RRH, O’Grady P, Wolfner MF, Harbison ST. 2020. Evolution of reproductive behavior. Genetics. 214(1):49–73. doi:10.1534/genetics.119.302263. - DOI - PMC - PubMed
    1. Arbuthnott D. 2009. The genetic architecture of insect courtship behavior and premating isolation. Heredity (Edinb). 103(1):15–22. doi:10.1038/hdy.2009.22. - DOI - PubMed
    1. Arthur BJ, Ding Y, Sosale M, Khalif F, Kim E, Waddell P, Turaga SC, Stern DL. 2021. Songexplorer: a deep learning workflow for discovery and segmentation of animal acoustic communication signals. bioRxiv 437280. 10.1101/2021.03.26.437280, preprint: not peer reviewed. - DOI
    1. Arthur BJ, Sunayama-Morita T, Coen P, Murthy M, Stern DL. 2013. Muli-channel acoustic recording and automated analysis of Drosophila courtship songs. BMC Biol. 11(1):11. doi:10.1186/1741-7007-11-11. - DOI - PMC - PubMed

LinkOut - more resources