. 2025 Mar 7;16(1):2297.
doi: 10.1038/s41467-025-57540-z.

An atypical atherogenic chemokine that promotes advanced atherosclerosis and hepatic lipogenesis

Affiliations

An atypical atherogenic chemokine that promotes advanced atherosclerosis and hepatic lipogenesis

Omar El Bounkari et al. Nat Commun. .

Abstract

Atherosclerosis is the underlying cause of myocardial infarction and ischemic stroke. It is a lipid-triggered and cytokine/chemokine-driven arterial inflammatory condition. We identify D-dopachrome tautomerase/macrophage migration-inhibitory factor-2 (MIF-2), a paralog of the cytokine MIF, as an atypical chemokine promoting both atherosclerosis and hepatic lipid accumulation. In hyperlipidemic Apoe-/- mice, Mif-2-deficiency and pharmacological MIF-2-blockade protect against lesion formation and vascular inflammation in early and advanced atherogenesis. MIF-2 promotes leukocyte migration, endothelial arrest, and foam-cell formation, and we identify CXCR4 as a receptor for MIF-2. Mif-2-deficiency in Apoe-/- mice leads to decreased plasma lipid levels and suppressed hepatic lipid accumulation, characterized by reductions in lipogenesis-related pathways, tri-/diacylglycerides, and cholesterol-esters, as revealed by hepatic transcriptomics/lipidomics. Hepatocyte cultures and FLIM-FRET-microscopy suggest that MIF-2 activates SREBP-driven lipogenic genes, mechanistically involving MIF-2-inducible CD74/CXCR4 complexes and PI3K/AKT but not AMPK signaling. MIF-2 is upregulated in unstable carotid plaques from atherosclerotic patients and its plasma concentration correlates with disease severity in patients with coronary artery disease. These findings establish MIF-2 as an atypical chemokine linking vascular inflammation to metabolic dysfunction in atherosclerosis.


Conflict of interest statement

Competing interests: J.B., R.B., and C.W. are co-inventors of patents covering anti-MIF strategies for inflammatory and cardiovascular diseases. C.Ko., A.K., O.E., and J.B. are co-inventors of a patent application covering MIF-binding CXCR4 ectodomain mimics for inflammatory and cardiovascular diseases. The remaining authors declare no competing interests.

Figures
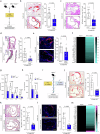
Fig. 1
Fig. 1. Genetic deletion or pharmacological inhibition of MIF−2 attenuates early atherosclerotic lesions and vascular inflammation in vivo.
a Experimental outline: Female Apoe–/– and Mif-2–/–Apoe–/– mice fed a cholesterol-rich HFD for 4.5 weeks. b ORO staining of aortic root sections and corresponding quantification (12 serial sections per mouse; n = 12 mice; each data-point represents one mouse; scale bar: 250 µm). c Same as (b) but HE staining. d HE staining and quantification of aortic arch sections (8 sections per mouse; n = 12 mice; scale bar: 200 µm). e Same as (b, c), except that sections were stained for CD68+ macrophages (red) and DAPI (blue); scale bar: 200 µm. fh Quantification of 40 inflammatory/atherogenic cytokines/chemokines in plasma samples by mouse cytokine array (n = 4 mice per group, analyzed in duplicate each). f Heatmap illustrating altered levels of cytokines/chemokines. Signals from Apoe–/– were normalized to 1 and compared with those from Mif-2–/–Apoe–/– mice (upregulated cytokines in magenta, downregulated in cyan). g, h Bar graphs of significantly altered cytokines/chemokines with relatively lower (h) or higher (g) plasma abundance. im Inhibition of MIF-2 by 4-CPPC in a 4.5-week HFD male Apoe–/– model. i Scheme of the experimental outline. Mice were administered 4-CPPC (5 mg/kg) or vehicle 3× per week (Syringe icon was created with BioRender.com). j ORO staining of aortic root sections and quantification (12 sections per mouse; n = 11 mice per group; scale bar: 200 µm). k Same as (j) but HE staining. l Same as (j), except that sections were stained for CD68+ macrophages (red) and DAPI (blue). m Quantitation of plasma cytokines/chemokines. Heatmap illustration of the 36 ProcartaPlex mouse cytokine/chemokine array (n = 4 mice per group analyzed in duplicate). Signals from vehicle-treated mice normalized to 1 and compared with those from 4-CPPC-treated mice (upregulated cytokines in magenta, downregulated in cyan). a and i were created in BioRender. Bernhagen, L. 2025 https://BioRender.com/c59v181. Values are expressed as means ± SD and statistically analyzed using an unpaired two-tailed t-test (be and jl) or multiple unpaired t-tests (g, h).
Fig. 2
Fig. 2. MIF-2 promotes atherogenic leukocyte arrest and chemotaxis.
a MonoMac6 adhesion on HAoECs under flow conditions after 2 h of MIF-2 (0.8–80 nM) stimulation compared to 16 nM MIF. For MIF-2 concentrations of 0.8–8 nM, n = 4 biological replicates; for 16–80 nM concentrations, n = 3 biological replicates. b Human peripheral blood monocytes were subjected to different concentrations of MIF-2 for 4 h and chemotaxis (Transwell migration) depicted as chemotactic index (n = 3 biological replicates). c Effect of 4-CPPC (1 h preincubation) on the migratory effect of 4 nM MIF-2 (n = 4 biological replicates each). d, e MIF-2-elicited (2–32 nM) monocyte chemotaxis in a 3D setup using single-cell tracking in x/y direction in µm. Representative experiments (MIF-2-elicited migration tracks in magenta), unstimulated control [‘random motility’] in gray. Tracks of 28–30 randomly selected cells per group recorded every 2 min for 2 h (d) and forward migration index plotted (e). For MIF-2 concentrations of 2–32 nM, n = 21; for the untreated group (−), n = 22. The experiment shown is one of three independent experiments with monocytes from different donors. f MIF-2-induced chemotaxis of primary B cells measured by Transwell migration (n = 4 biological replicates, 4 h). g Effect of the MIF and MIF-2 inhibitor 4-IPP on MIF-2-elicited primary B-cell chemotaxis (n = 6 biological replicates). Solvent control: 0.1% DMSO. h, i Effect of MIF-2 on B-cell homing in vivo. Scheme illustrating the homing experiment. Fluorescently-labeled primary splenic B cells from wild-type (WT) C57BL/6 mice were i.v.-injected into WT or Mif–/– recipients and ‘homed’ B cells isolated from target organs and quantified (h). Quantification of B lymphocytes homed into spleen (i). h was created in BioRender. Bernhagen, L. 2025 https://BioRender.com/c59v181. Values are represented as means ± SD with individual data points shown; statistical analysis was performed by one-way ANOVA with Dunnett’s multiple comparisons (af), two-tailed Student’s t-test for multiple unpaired comparison (g), or Mann–Whitney test (i).
Fig. 3
Fig. 3. MIF-2 is a potent chemokine and CXCR4 ligand, and promotes foam-cell formation.
a Direct comparison of the chemotactic potency of MIF and MIF-2 on primary B lymphocytes by 3D chemotaxis (recorded at 2 min intervals for 2 h). Left, buffer in both chambers (control); middle, MIF-2 versus buffer; right, MIF-2 versus MIF competition. Experiment shown is one of three independent experiments with B cells from different mice. b Alignment of human MIF-2 and MIF amino acid sequences with residues implicated in receptor binding (aligned by ClustalW) indicated. Identical/homologous residues are highlighted by thesame colors. c, d Effect of MIF-2 on B-cell migration (Transwell setup) and dependence on CD74 and CXCR4. Anti-CD74 antibody (LN2) (c), CXCR4 antagonist AMD3100 (AMD), and pertussis toxin (PTX) (d) were applied to probe receptor specificity. Untreated (−), MIF-2 and AMD3100, n = 8; PTX, n = 10. e, f Effect of MIF-2 on CXCR4 internalization in primary mouse B cells. Concentration-dependency at 15 min with CXCL12 as positive control (e). Time-dependent effect at 4 nM MIF-2 (f). gi Effect of MIF-2 on CXCR4 signaling in S. cerevisiae reporter-cell system. Scheme of MIF-2/CXCL12-induced signaling in yeast-CXCR4 reporter assay (g). Concentration-dependent reporter activity (n = 3 biological replicates); h and MIF-2 vs MIF comparison at 10 versus 20 µM (n = 3 biological replicates; i). j In situ molecular-docking simulation of monomeric MIF-2 (blue) and CXCR4 (yellow-gold) using HADDOCK, shown in ribbon (top) and surface area (bottom) views. CXCR4 extracellular loops: ECL1, ECL2 (red), ECL3 (green). k, l Fluorescence-spectroscopic titration of CXCR4 surrogate peptide Fluos-msR4M-L1 (5 nM) with increasing MIF-2 concentrations. Emission spectra (k), binding curve at 522 nm (n = 3 independent experiments; l). m, n Effect of MIF-2 on DiI-LDL uptake in primary human monocyte-derived macrophages and dependence on CXCR4. MIF-2 (80 nM), AMD3100, 4-IPP, and 4-CPPC (10 µM each). Representative images (m) and quantification (n = 4 independent experiments; 9 fields-of-view each) (n). Scale bar: 100 µm. Values are expressed as means ± SD. Statistical analysis: two-tailed unpaired Student’s t-test (e, f) and one-way ANOVA with Tukey’s multiple comparisons (c), with Dunnett’s multiple comparisons (d, h, i), or with Šídák’s multiple comparisons (n).
Fig. 4
Fig. 4. Mif-2 deficiency ameliorates advanced atherosclerotic lesion progression in hyperlipidemic Apoe−/− mice.
a Experimental outline: female Apoe–/– and Mif-2–/–Apoe–/– mice fed a cholesterol-rich HFD for 12 weeks. bd Effect of Mif-2 deficiency on lesion formation in aortic root. ORO staining (b) and HE staining (c) of aortic root and corresponding quantification. HE staining of aortic arch and quantification (d). Data points in (bd) represent n = 10 for Apoe–/– and n = 8 for Mif-2–/–Apoe–/–; 12 serial sections per mouse; scale bar: 200 µm. e Same as (b, c) except that the sections were stained for CD68+ macrophages (red) and DAPI (blue) (Apoe–/–: n = 10, Mif-2–/–Apoe–/–: n = 8). f Effect of Mif-2 deficiency on necrotic core formation (Masson staining). Typical necrotic core marked by red asterisk (Apoe–/–: n = 10, Mif-2–/–Apoe–/–: n = 8; scale bar: 200 µm). g Quantitation of plasma cytokines/chemokines from 4 mice per group. Heatmap of 36 ProcartaPlex mouse cytokine/chemokine array result. Signals from Apoe–/– mice normalized to 1 and compared with those from Mif-2–/– Apoe–/– mice (upregulated cytokines in magenta, downregulated in cyan). h, i Comparison of body weights between Mif-2–/–Apoe–/– and Apoe–/– mice at 0 and 12 weeks of HFD. Representative Apoe–/– mouse compared to Mif-2–/– Apoe–/– mouse after 12 weeks HFD (h) and corresponding body weights at 0 and 12 weeks of HFD (Apoe–/–: n = 9; Mif-2–/–Apoe–/–: n = 6 (0-week HFD), n = 8 (12-week HFD)) (i). j, k Comparison of plasma lipid levels between Mif-2–/–Apoe–/– and Apoe–/– mice fed a HFD for 12 weeks; triglycerides (j), total cholesterol (k) (Apoe–/–: n = 10, Mif-2–/–Apoe–/–: n = 8). l Lipoprotein profiles of Apoe–/– versus Mif-2–/–Apoe–/– mice after 12-week HFD. Representative FPLC chromatograms of lipoprotein fractions with peaks for VLDL, LDL, and HDL. a was created in BioRender. Bernhagen, L. 2025 https://BioRender.com/c59v181. All values are represented as means ± SD and were analyzed using unpaired two-tailed Student’s t-test.
Fig. 5
Fig. 5. MIF-2 increases hepatosteatosis and elicits SREBP-mediated lipogenesis in hepatocytes.
a, b Representative liver images from Apoe–/– and Mif-2–/–Apoe–/– mice after 12 weeks on cholesterol-rich HFD (a) and corresponding liver weights (n = 9 mice per group) (b). c HE-stained liver sections from Apoe–/– and Mif-2–/–Apoe–/– mice after 12 weeks HFD (n = 3 mice; scale bar: 200 µm). White areas indicate lipid accumulation. dg Effect of MIF-2 on SREBP activation and lipogenic gene expression in Huh-7 cells. Protein levels of SREBP-1 precursor (pSREBP-1), nuclear SREBP-1 (nSREBP-1), and FASN analyzed via Western blot (d) and corresponding densitometric quantification relative to β-actin (e) (SREBP-1/β-actin: n = 4; FASN/β-actin n = 3). f, g Same as (d, e) except that nSREBP-2 and LDLR were analyzed (SREBP-2/β-actin: n = 4; LDLR/β-actin n = 3). h MIF-2 stimulation enhances nuclear translocation of nSREBP-2 in Huh-7 cells compared to buffer. Immunofluorescent images show SREBP-2 (green), DAPI (blue) and magnified images in right panel (representative of two separate experiments, scale bar: 40 µm). i Protein levels of processed SREBP (nSREBP)-1/-2 in liver lysates from Apoe–/– and Mif-2–/–Apoe–/– mice (n = 4) analyzed by Western blot. jm Bulk RNAseq analysis of liver sections from Apoe–/– and Mif-2–/–Apoe–/– mice after 12 weeks of cholesterol-rich HFD. j Schematic of workflow (Liver, liver section, and RNA sequencing equipment icons were created with BioRender.com). k Volcano plot of differential gene expression. Red dots: significant genes (Padj < 0.05; log2-fold change>1.5; up in Apoe–/–, down in Mif-2–/–Apoe–/– mice); dark-gray: non-significant (log2-fold change<1.5); green dots: log2-fold change > 1.5 and Padj > 0.05; blue: log2-fold change < 1.5 and Padj < 0.05. l Heatmap of significantly changed genes (P < 0.05) showing many linked to lipid metabolism (n = 4 mice per group). m GO pathway analysis (dot plot representation) showing terms significantly enriched in Apoe–/– compared to Mif-2−/−Apoe–/– mice. Dot size (counts) represents number of genes populating a term; color code indicates significance (−log10(Padj)). j was created in BioRender. Bernhagen, L. 2025 https://BioRender.com/c59v181. All values are means ± SD with individual data points shown; statistical analysis by two-tailed Student’s t-test.
Fig. 6
Fig. 6. MIF-2 deficiency reduces lipid accumulation and alters lipid composition in the livers of atherogenic Apoe–/– mice.
ac Comparison of liver lipid concentrations of triacylglycerides (a), diacylglycerides (b), and cholesterol esters (c) between Mif-2–/– Apoe–/– and Apoe–/– mice after 12 weeks on cholesterol-rich high-fat diet (HFD). Lipid concentrations (nmol/g) were determined using differential mobility separation (DMS)-driven shotgun lipidomics. Apoe–/– mice (n = 6 mice), Mif-2–/– Apoe–/– (n = 5 mice). d Heatmap displaying fold changes of fatty acid concentrations across various lipid classes in Mif-2–/–Apoe–/– versus Apoe–/– mice including triacylglycerides (TG), diacylglycerides (DG), and cholesteryl esters (CE). Colors represent fold change, with green indicating a reduction and red indicating an increase in respective lipid concentration. Data are presented as means ± SEM and were analyzed using an unpaired two-tailed Student’s t-test. Statistically significant differences are indicated by asterisks based on Benjamini–Hochberg adjusted P-values (d). HexCER hexosylceramides, Cer d18:1 C18 ceramides (d18:1), Cer d18:0 C18 ceramides (d18:0), FA free fatty acids, LacCER lactosylceramides, LPE lysophosphatidylethanolamines, LPS lysophosphatidylserines, PA phosphatidic acids, PC phosphatidylcholines, PE phosphatidylethanolamines, LPC lysophosphatidylcholines, PG phosphatidylglycerols, PI phosphatidylinositols, PS phosphatidylserines, SM sphingomyelins.
Fig. 7
Fig. 7. MIF-2 triggers CD74/CXCR4 complex formation in HEK293 cells and hepatocytes.
a, b Role CD74 and CXCR4 in MIF-2-elicited SREBP activation in Huh-7 hepatocytes. Cells were stimulated with 16 nM MIF-2 in the presence of AMD3100 (AMD), CD74-blocking antibody (LN2), or both; control: isotype IgG. Representative Western blots for SREBP−1 and FASN (a), and SREBP-2 and LDLR (b) from two independent experiments. c Effect of MIF-2 on LDL uptake in Huh-7 hepatocytes and blockade by CXCR4 and CD74 inhibitors. ORO staining to visualize lipids (scale bar: 25 µm). Images representative of two separate experiments. d MIF-2 does not affect CXCR4 internalization without CD74. Splenic B cells from Cd74–/– mice were stimulated with MIF-2 or CXCL12 for 20 min, and CXCR4 expression monitored by flow cytometry. Statistical analysis: unpaired two-tailed Student’s t-test; ns, not significant. e Proximity ligation assay (PLA) showing CXCR4/CD74 interaction in NIH/3T3 cells. Transfected cells with CXCR4-Myc and FLAG-CD74 plasmids were probed with anti-Myc and anti-FLAG antibodies. PLA signals (red); nuclei stained with DAPI (blue) (scale bar: 20 µm). Images representative of two separate experiments. fi FLIM-FRET microscopy analysis of CXCR4/CD74 interaction in Huh-7 cells. f Schematic of the experiment. g Two/multi-photon microscopy of ECFP-CXCR4 (cyan) and EYFP-CD74 (magenta) colocalization in fixed Huh-7 cells. h, i FLIM analysis of FRET efficiency between ECFP-CXCR4 and EYFP-CD74 (FLIM image (h) and histogram (i)). Scale bar: 10 µm. jn MIF-2 promotes CXCR4/CD74 complex formation in HEK293 cells. j Experimental schematic. k Co-colocalization of ECFP-CXCR4 (cyan) and EYFP-CD74 (magenta) in unstimulated, live HEK293 cells. Scale bar: 10 µm. l Normalized fluorescence-lifetime decay curves of ECFP-CXCR4 over time (decrease from ~t1 = 2.47 ns to ~t2 = 2.00 ns). n FRET efficiency images at one-minute intervals (m); Scale bar: 10 µm. Histogram of FRET efficiency after 10 min of MIF-2stimulation. or MIF-2 promotes CXCR4/CD74 complex formation in Huh-7 cells. Experimental scheme as in (j), but Huh-7 cells were fixed after 20 min of treatment. o Co-colocalization of ECFP-CXCR4 (cyan) and EYFP-CD74 (magenta) in unstimulated Huh-7 cells. Scale bar: 10 µm. p FRET efficiency image, Scale bar: 10 µm, q histogram, and comparison between FLIM-FRET efficiencies of treated and untreated cells (r).
Fig. 8
Fig. 8. Upregulation of MIF-2 expression in unstable human carotid plaques and correlation with acute CAD.
a, b MIF-2 expression in plaques from patients undergoing CEA. a MIF-2 immunopositivity in stable and unstable plaques and comparison to healthy vessels. Representative DAB staining from FFPE plaque sections developed with an anti-MIF-2 antibody (right). Unstained (control without primary antibody, left). Images are representative of 4 vessels per group. Scale bar: 500 µm. b MIF-2 mRNA expression in stable versus unstable plaques measured by RT-qPCR. n = 15 patients per group. Values are means ± SD and were analyzed using an unpaired two-tailed Student’s t-test. ch MIF-2 levels in plasma of CAD patients and correlations with clinical parameters. c Comparison of MIF-2 and MIF concentrations determined by ELISA (n = 149 patients). Statistics: unpaired two-tailed Student’s t-test. d Correlation between MIF-2 and MIF (Spearman’s rank correlation R = 0.5130, P < 0.0001). e MIF-2 plasma levels in sub-groups of patients with chronic coronary syndrome (CCS; n = 85) and acute coronary syndrome (ACS; n = 47). Statistics: unpaired two-tailed Student’s t-test and Mann–Whitney test. f MIF-2 levels according to vessel disease score (scale 0–3). Statistics: unpaired two-tailed Student’s t-test and Mann–Whitney test. g Correlation analysis of MIF and MIF-2 plasma levels with baseline clinical parameters, including cardiovascular risk factors, laboratory parameters, and medication. Significant Pearson coefficients () (P < 0.05) highlighted and colored accordingly. h Orthogonal partial least squares discriminant analysis (OPLS-DA) score plots between ACS and CCS patients including MIF, MIF-2, and clinical/laboratory parameters (R2X = 0.681; R2Y = 0.343; Q2 = 0.239). Dots represent individual patients colored according to disease severity (ACS = orange; CCS = blue).

References

    1. Joseph, P. et al. Reducing the global burden of cardiovascular disease, part 1: the epidemiology and risk factors. Circ. Res.121, 677–694 (2017). - PubMed
    1. Libby, P., Ridker, P. M. & Hansson, G. K. Progress and challenges in translating the biology of atherosclerosis. Nature473, 317–325 (2011). - PubMed
    1. Virani, S. S. et al. Heart disease and stroke statistics-2020 update: a report from the American Heart Association. Circulation141, e139–e596 (2020). - PubMed
    1. Ross, R. Atherosclerosis–an inflammatory disease. N. Engl. J. Med.340, 115–126 (1999). - PubMed
    1. Weber, C. & Noels, H. Atherosclerosis: current pathogenesis and therapeutic options. Nat. Med.17, 1410–1422 (2011). - PubMed

MeSH terms