. 2025 Mar 7;16(1):2287.
doi: 10.1038/s41467-025-57096-y.

Continuous map of early hematopoietic stem cell differentiation across human lifetime

Affiliations

Continuous map of early hematopoietic stem cell differentiation across human lifetime

Hana Komic et al. Nat Commun. .

Abstract

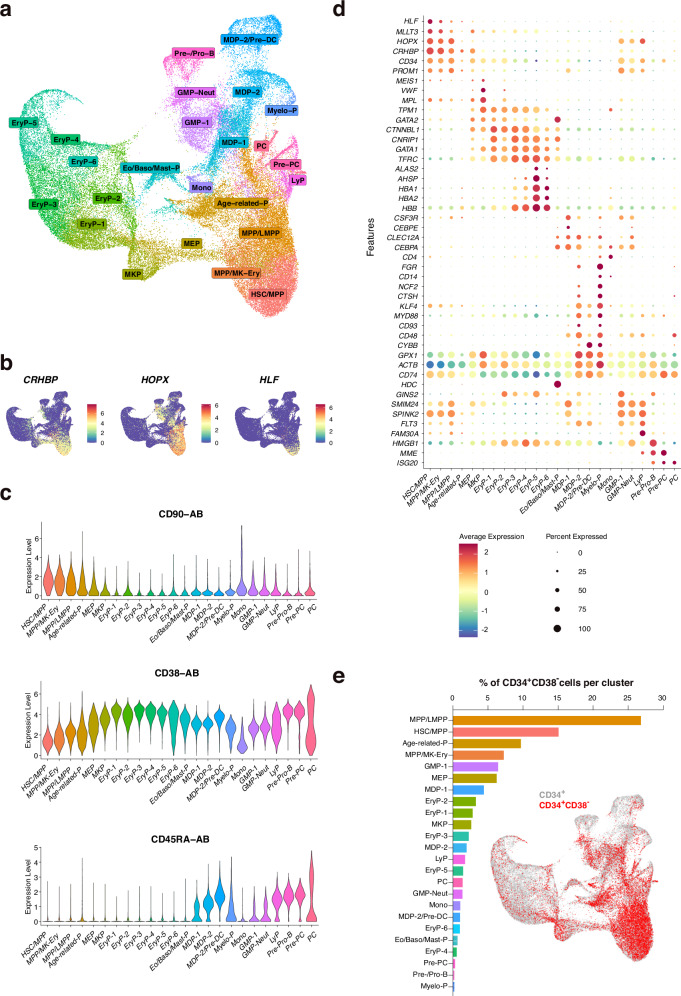
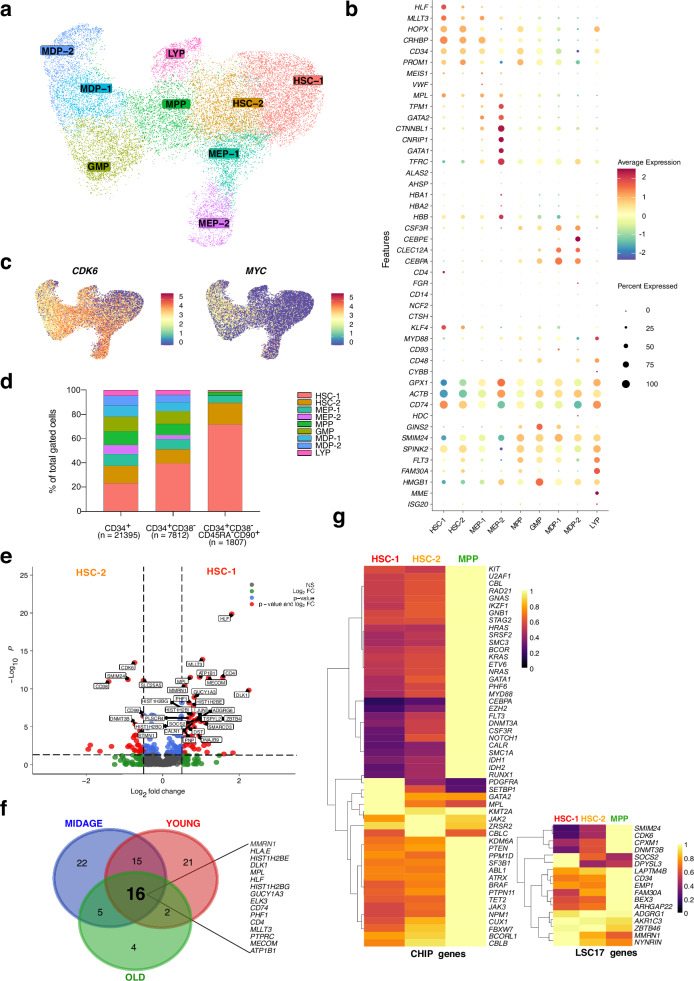
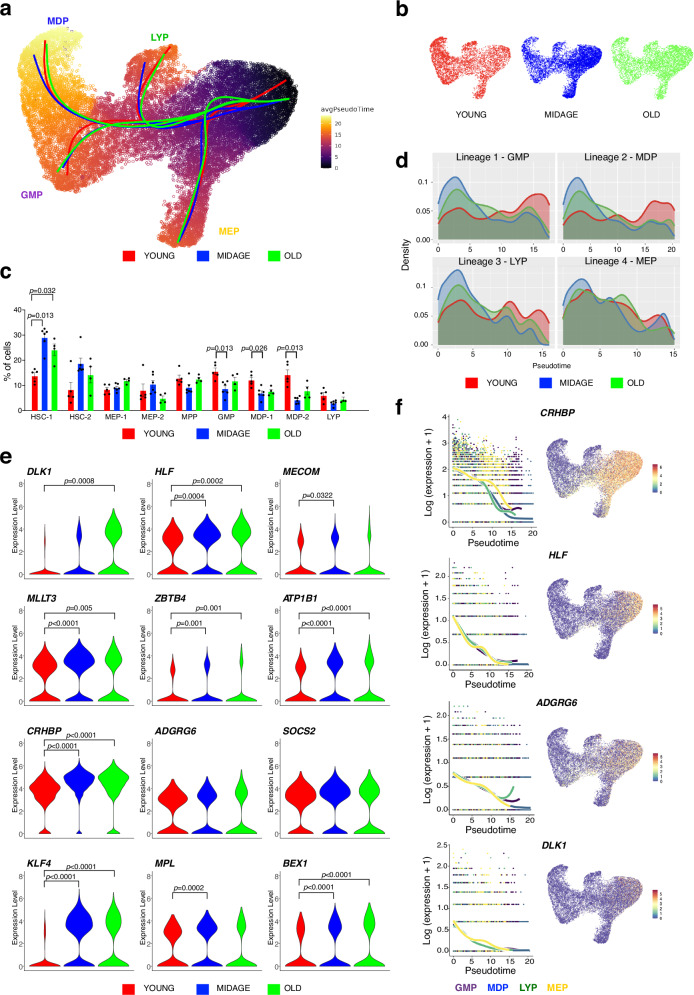
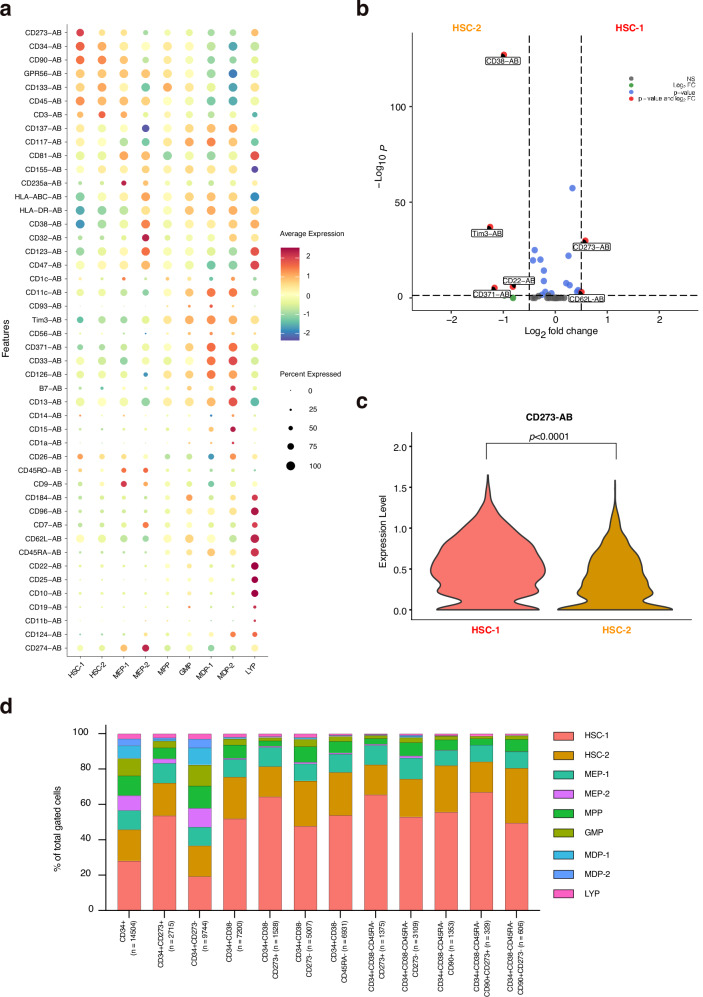
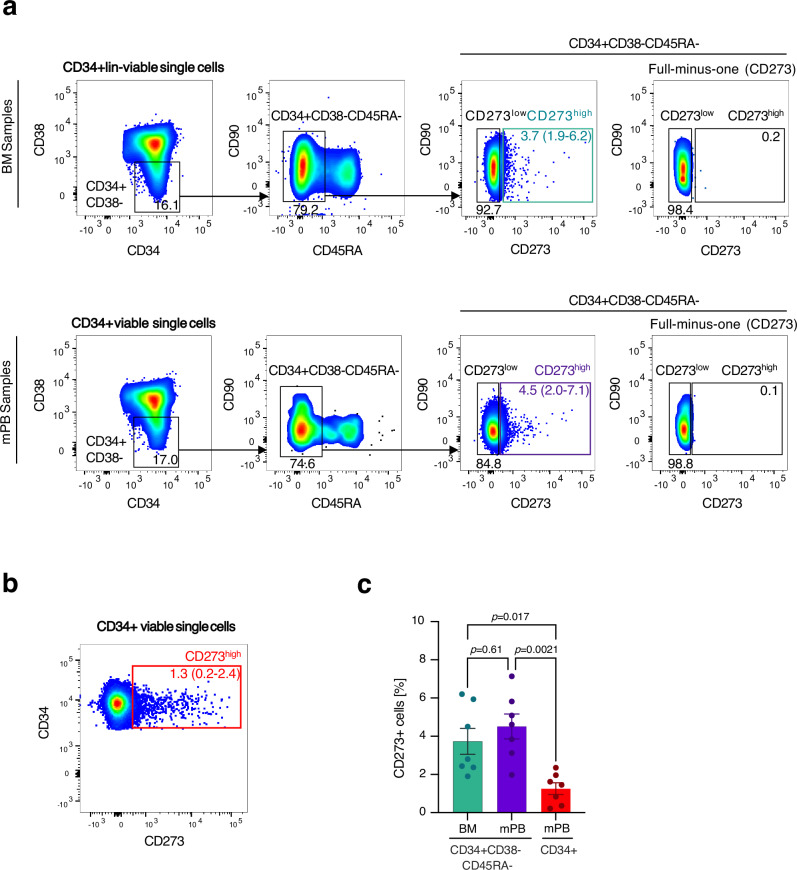
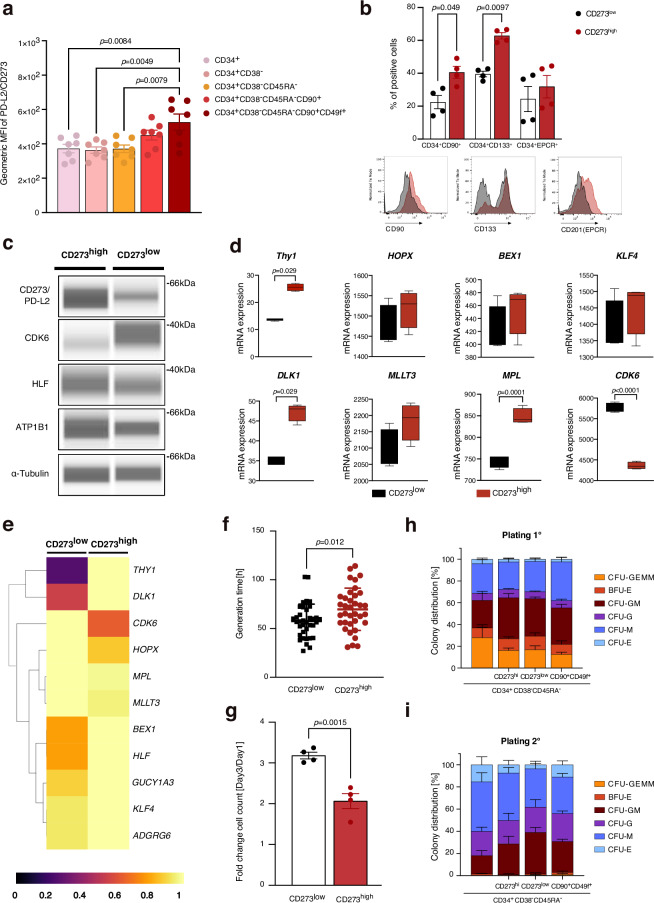
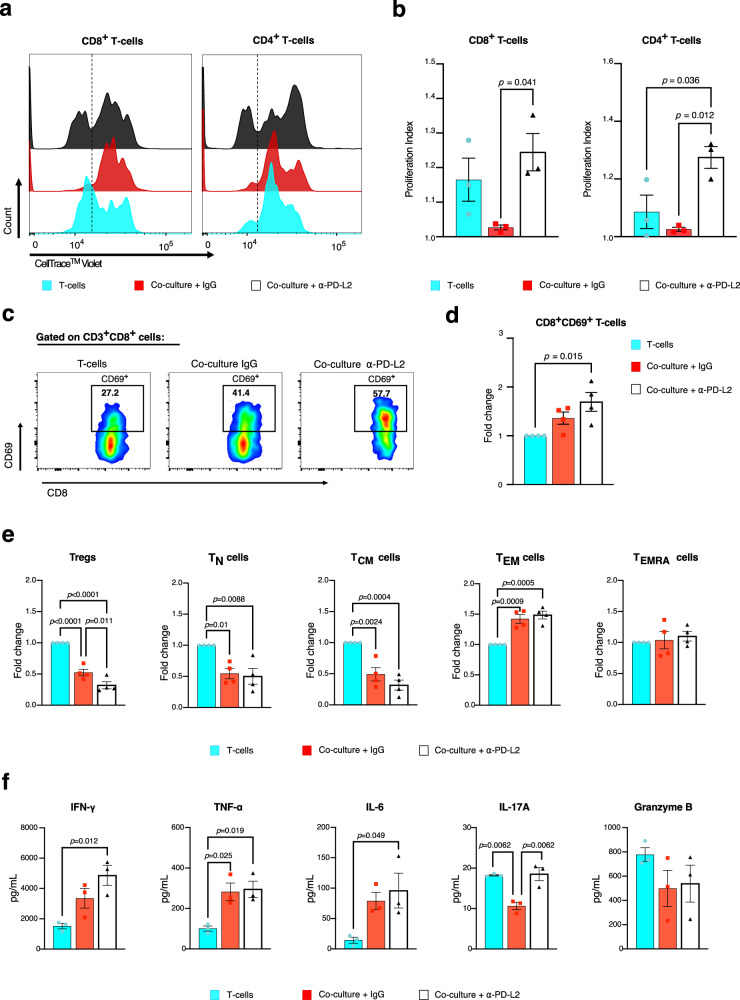
Uncovering early gene network changes of human hematopoietic stem cells (HSCs) leading to differentiation induction is of utmost importance for therapeutic manipulation. We employed single cell proteo-transcriptomic sequencing to FACS-enriched bone marrow hematopoietic stem and progenitor cells (HSPCs) from 15 healthy donors. Pseudotime analysis reveals four major differentiation trajectories, which remain consistent upon aging, with an early branching point into megakaryocyte-erythroid progenitors. However, young donors suggest a more productive differentiation from HSPCs to committed progenitors of all lineages. tradeSeq analysis depicts continuous changes in gene expression of HSPC-related genes (DLK1, ADGRG6), and provides a roadmap of gene expression at the earliest branching points. We identify CD273/PD-L2 to be highly expressed in a subfraction of immature multipotent HSPCs with enhanced quiescence. Functional experiments confirm the immune-modulatory function of CD273/PD-L2 on HSPCs in regulating T-cell activation and cytokine release. Here, we present a molecular map of early HSPC differentiation across human life.


Conflict of interest statement

Competing interests: The authors received research funding in the form of free reagents from BD Biosciences within the BD Multiomics Alliance. H.B. has received licensing fees and royalties from Medac, research support from Erydel, Miltenyi, Sandoz-Hexal (a Novartis company), honoraria or speaker fees from Medac, Miltenyi, Novartis and Terumo BCT, consultancy or membership in advisory boards for Apriligen, Arensia, Boehringer-Ingelheim Vetmed, Celgene (a BMS company), Editas, Medac, NMDP, Novartis, Provirex and Sandoz-Hexal, and acknowledges stock ownership in Healthineers, none of which are of relevance to the work at hand. B.P. reports honoraria for lectures from and membership on advisory boards with Adaptive, Amgen, Becton Dickinson, Bristol-Myers Squibb-Celgene, Janssen, Merck, Novartis, Roche, Sanofi and Takeda; unrestricted grants from Bristol-Myers Squibb-Celgene, EngMab, Roche, Sanofi, and Takeda; and consultancy for Bristol-Myers Squibb-Celgene, Janssen, Sanofi, and Takeda, none of which are of relevance to the work at hand. The remaining authors declare no competing interests.

Figures

Fig. 1
Fig. 1. Single cell transcriptomic/AbSeq profiling of CD34+cells from human BM.
a UMAP visualization of gene expression-based clustering analysis of 62,277 CD34+ cells from 15 donors with cluster annotation. b Feature plots for the expression of human stem cell gene markers. c Violin plots showing the surface protein expression of CD90, CD38 and CD45RA, detected by Transcriptomic/AbSeq. d Dot-plot visualization of gene expression of previously defined cell type-specific markers. e Distribution of FACS-sorted CD34+CD38 cells in respective clusters and visualized on the UMAP, demonstrating enrichment in most immature cell clusters.
Fig. 2
Fig. 2. Proteo-transcriptomic profiling and differential gene expression of early immature HSPCs.
a UMAP visualization of gene expression-based re-clustering analysis of cells selected from clusters HSC/MPP, MPP/MK-Ery, MPP/LMPP, MEP, MDP-1, GMP-1, GMP-Neut, LyP (Fig. 1) with cluster annotation. b Dot-plot showing expression levels of selected lineage specific genes. c Feature plots of cell-cycle and proliferation genes CDK6 and MYC, confirming quiescence of the most immature cells. d Hierarchical gating of HSPC populations based on AbSeq surface protein expression and distribution in clusters. e Differential pseudobulk gene expression analysis of cells in clusters HSC-1 and HSC-2. Two-sided Wald test with Benjamini-Hochberg correction. f Venn-diagram showing comparison of upregulated genes in cluster HSC-1 between individual age group. g Clonal hematopoiesis-driver gene and LSC17 stemness gene expression patterns in clusters HSC-1, HSC-2 and MPP.
Fig. 3
Fig. 3. Pseudotime trajectories in different age groups.
a Slingshot pseudotime analysis identified four trajectories. b UMAP visualization of cells from each age group. c Distribution of cells per cluster from each age group. Wilcoxon Rank Sum test with Holm-Bonferroni correction. Bars represent the mean with SEM. d Density plots along pseudotime for each trajectory show age-group specific differences. e Violin plots of expression of stem cell-related genes from cells in cluster HSC-1 of each age group. Two-sided Wald test with Benjamini-Hochberg correction. f Continuous expression of selected genes highly expressed in HSC-1 along pseudotime calculated by tradeSeq regression model based on lineage trajectories.
Fig. 4
Fig. 4. Surface protein expression in immature HSPC subpopulations determined by AbSeq.
a Dot-plot showing surface expression level of all analyzed proteins. b Volcano plot represents differentially expressed surface proteins between cluster HSC-1 versus HSC-2. Wilcoxon Rank Sum test with Bonferroni correction. c Surface expression of CD273 (PD-L2) in cells from clusters HSC-1 and HSC-2. Wilcoxon Rank Sum test with Bonferroni correction. d Hierarchical gating of HSPC populations based on the AbSeq surface protein expression and distribution in clusters.
Fig. 5
Fig. 5. FACS sorting of CD273high and CD273low HSPCs.
a Pseudocolor density plots illustrating the hierarchical gating strategy used for isolation of CD34+CD38CD45RAlin HSPCs according to their CD273 expression from adult bone marrow (BM) and mobilized peripheral blood (mPB). The first plot shows pre-gated viable, singlet CD34+ lin cells. b CD273 expression of CD34+ MACS-enriched mPB. c Percentage of CD273high cells within the indicated populations. Bars represent the mean with SEM (n=7 donors). One-way ANOVA with Tukey’s multiple comparisons test.
Fig. 6
Fig. 6. Functional characterization of CD273/PD-L2 expressing HSPCs.
a CD273 surface expression level on different HSPC populations (n = 7 donors) by flow cytometry. One-way ANOVA with Tukey’s multiple comparisons test. bf CD273high and CD273low CD34+CD38CD45RA HSPCs were FACS-sorted for analyses (see Fig. 5). b CD273high HSPCs show delayed in vitro differentiation. Cells were analyzed after 7 days of culture by flow cytometry (n = 4 donors). Two-way ANOVA with Šídák’s multiple comparisons test c) Protein expression of CD273 and stem cell-related marker proteins in FACS-sorted CD273high and CD273low HSPCs determined by Simple Western technology. d Expression of stem cell signature genes measured by bulk RNA-Seq of FACS-sorted CD273high and CD273low HSPCs (n = 4 donors). Box extends from 25th–75th percentiles, marking the mean with a distinct line. The whiskers reach out to the maximum and minimum data point. Two-tailed Mann-Whitney test (THY1, BEX1, KLF4, DLK1) and two-tailed unpaired t-test (HOPX, MLLT3, MPL, CDK6). e Expression of stem cell signature genes measured on hierarchically gated CD273high and CD273low HSPCs from AbSeq analysis showed the same pattern as bulk RNA-Seq in d. f Videomicroscopy-based single cell tracking of FACS-sorted CD273high and CD273low HSPCs showed delayed entry into first cell cycle of CD273high HSPCs (n > 35 cells). Two-tailed unpaired t-test. g Fold expansion of FACS-sorted CD273high and CD273low HSPCs after 3 days in vitro culture (n = 4 donors). Two-tailed unpaired t-test. h Colonies determined by colony-forming unit assay (CFU) after 14 days (n = 5 donors). Two-way ANOVA with Tukey’s multiple comparisons test. i Replating of primary CFU (n = 4 donors). Two-way ANOVA with Tukey’s multiple comparisons test. Bars represent the mean with SEM.
Fig. 7
Fig. 7. Immune-modulatory function of CD273/PD-L2 on HSPCs.
T-cells were co-cultured with allogeneic HSPCs in the presence of either PD-L2 blocking antibody or an isotype control antibody for 72 h, and compared to a T-cell mono-culture. a Proliferation of CD4+ and CD8+ T-cells by CFSE labeling (n = 3 donors). b Proliferation index of CD4+ and CD8+ T-cells (n = 3 donors). One-way ANOVA with Tukey’s multiple comparisons test. c Flow cytometry analysis of CD69 expression on CD8+ T-cells. d Activation of CD8+ T-cells (n = 4 donors). One-way ANOVA with Holm-Šídák’s multiple comparisons test. e T-cell subtype abundances relative to T-cell mono-culture (n = 4 donors). Tregs regulatory T-cells; TN naïve T-cells, TCM central memory T-cells; TEM effector memory T-cells; TEMRA terminally differentiated effector memory T-cells re-expressing CD45RA. One-way ANOVA with Holm-Šídák’s multiple comparisons test. f Cytokine-bead array assay of co-culture and T-cell mono-culture supernatants (n = 3 donors). One-way ANOVA with Tukey’s multiple comparisons test. All bars represent the mean with SEM.

Similar articles

References

    1. Rieger, M. A. & Schroeder, T. Hematopoiesis. Cold Spring Harbor Perspect. Biol.4, 10.1101/cshperspect.a008250 (2012). - PMC - PubMed
    1. Haas, S., Trumpp, A. & Milsom, M. D. Causes and Consequences of Hematopoietic Stem Cell Heterogeneity. Cell Stem Cell22, 627–638 (2018). - PubMed
    1. Muller-Sieburg, C. E., Sieburg, H. B., Bernitz, J. M. & Cattarossi, G. Stem cell heterogeneity: implications for aging and regenerative medicine. Blood119, 3900–3907 (2012). - PMC - PubMed
    1. Notta, F. et al. Isolation of single human hematopoietic stem cells capable of long-term multilineage engraftment. Science (N. Y., N. Y.)333, 218–221 (2011). - PubMed
    1. Lu, R., Czechowicz, A., Seita, J., Du, J. & Weissman, I. L. Clonal-level lineage commitment pathways of hematopoietic stem cells in vivo. Proc. Natl. Acad. Sci. USA116, 1447–1456 (2019). - PMC - PubMed