. 2025 Mar 8;11(1):92.
doi: 10.1038/s41420-025-02378-z.

Thyroid hormones inhibit tumor progression and enhance the antitumor activity of lenvatinib in hepatocellular carcinoma via reprogramming glucose metabolism

Affiliations

Thyroid hormones inhibit tumor progression and enhance the antitumor activity of lenvatinib in hepatocellular carcinoma via reprogramming glucose metabolism

Chun-Cheng Yang et al. Cell Death Discov. .

Abstract

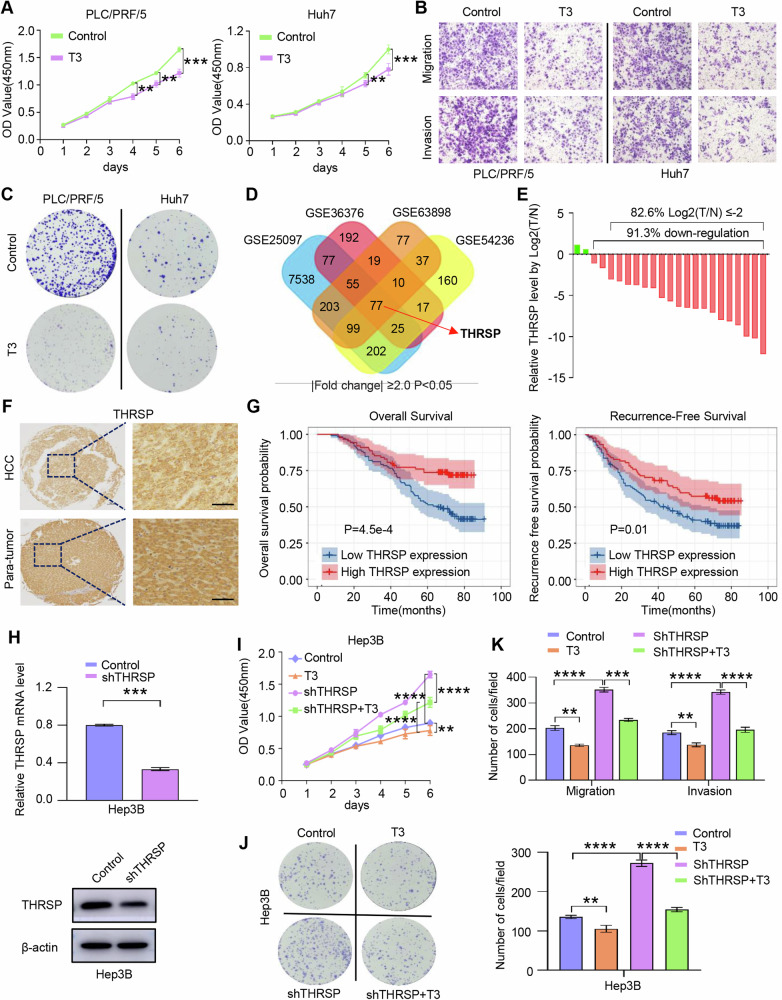
Thyroid hormones (THs) dysfunctions have been demonstrated to be associated with the risk of developing different types of cancers. The role of THs in regulating hepatocellular carcinoma (HCC) progression is still controversial. We demonstrated that T3 can inhibit HCC progression by enhancing the expression of THRSP. Mechanistically, T3 can activate tumor suppressor LKB1/AMPK/Raptor signaling as well as oncogenic PI3K/Akt signaling in HCC. Interestingly, T3-induced THRSP can augment the activation of LKB1/AMPK/Raptor signaling, yet inhibit T3-induced PI3K/Akt signaling activation, thereby preventing mTOR-induced nuclear translocation of HIF-1α, and ultimately suppressing ENO2-induced glycolysis and HCC progression. More importantly, the exogenous T3 enhances the antitumor effect of multikinase inhibitor lenvatinib in vitro and in vivo by regulating glycolysis. Our findings reveal the role and mechanism of THs in HCC progression and glucose metabolism and provide new potential therapeutic strategies for HCC treatment and drug resistance reversal.


Conflict of interest statement

Competing interests: The authors declare no competing interests. Consent for publication: All authors have agreed to publish this manuscript. Declaration of informed consent to participate in research: The participants are fully informed about the purpose, procedures, potential risks, benefits, rights, and confidentiality of the data in this study. Participants voluntarily signed the consent form based on a full understanding of the information (Ethics approval number: KYLL-202111-015). Ethics approval and consent to participate: This study was approved by the Ethics Committee of the Qilu Hospital Biomedical Research Department and written consent was obtained from all participants. All methods were performed in accordance with the relevant quidelines and requlations.

Figures

Fig. 1
Fig. 1. THs inhibit HCC progression by enhancing THRSP expression.
AC CCK-8, Transwell assay, and Colony formation assay were used to determine the influence of T3 on the proliferation, migration, invasion, and colony formation ability of HCC cells. D THRSP was significantly differentially expressed in HCC tissues from the GEO sequencing dataset. E qRT-PCR revealed that THRSP was significantly downregulated in HCC tissue samples. F The changes of THRSP expression in representative HCC samples in TMA were observed by IHC staining. Scale bar, 50 μm. G Kaplan-Meier analysis showed that the high THRSP expression in HCC tissues was associated with better OS and RFS. H qRT-PCR and WB confirmed the KD of THRSP in Hep3B cells. IK THRSP knockdown attenuated the inhibitory effect of T3 on cell proliferation, clone formation, migration, and invasion ability in HCC cells. **P < 0.01; ***P < 0.001; ****P < 0.0001.
Fig. 2
Fig. 2. THRSP mediates THs-induced HCC inhibition and glucose metabolism by regulating LKB1/AMPK and PI3K/Akt pathway.
A, B RNA-seq revealed the number of significantly up-regulated, downregulated, and common DEGs in THRSP-OE HCC cells. C Heat map of DEGs in THRSP-OE cells compared to the control group. D Genomic enrichment analysis of THRSP high and low expression in the TCGA database. E KEGG pathway enrichment analysis of the gene set negatively associated with THRSP in human HCC samples. F The effect of THRSP on glycolysis in T3-treated HCC cells. G T3 can activate the LKB1/AMPK signaling pathway and the PI3K/Akt signaling pathway in HCC. H WB showed that THRSP activated the LKB1/AMPK pathway, yet inhibited the PI3K/Akt signaling pathway in HCC.
Fig. 3
Fig. 3. THRSP mediates THs-induced HCC inhibition and glucose metabolism by inhibiting the transcription and expression of ENO2.
A, B qRT-PCR and WB confirmed that THRSP could regulate ENO2 expression in HCC cells. C The ENO2 expression was associated with the HCC tumor stage. D Kaplan–Meier analysis demonstrated that the ENO2 level was a predictive factor of OS and RFS in HCC patients. E WB results confirmed that T3 could inhibit the ENO2 expression in HCC in vitro. F, G ENO2 could attenuate the regulatory effects of T3 on glycolysis levels in HCC cells. **P < 0.01.
Fig. 4
Fig. 4. THRSP mediates THs-induced HCC inhibition through inhibiting mTOR-induced HIF-1α nuclear translocation.
A T3 activates phosphorylation of Raptor and mTOR, while THRSP activates Raptor phosphorylation and inhibits mTOR phosphorylation and mTOR-induced HIF-1α nuclear translocation. B, C qRT-PCR and WB showed that LKB1 knockdown significantly inhibited the phosphorylation levels of AMPK and Raptor, and promoted nuclear translocation of HIF-1α and ENO2 expression. D LKB1 knockdown promoted glycolysis levels in HCC cells. E qRT-PCR detected the effect of MK-2206 treatment (10 μM, 48 h) on the ENO2 mRNA level in HCC cells. F WB analysis showed that MK-2206 reduced the levels of p-AKT, p-mTOR, and ENO2, and inhibited the nuclear translocation of HIF-1α in HCC cells. G MK-2206 reduces the glycolysis rate and glycolysis level in HCC cells. H Western blotting analysis was used to determine the effect of Rapamycin (10 μM, 48 h) on the levels of the indicated proteins in Hep3B THRSP-KD cells. I Knockdown of HIF-1α suppressed the ENO2 expression in Hep3B THRSP-KD cells. J ChIP-qRT-PCR showed statistically significant levels of HIF-1α bound to the ENO2 promoter in HCC cells. *P < 0.05; **P < 0.01; ***P < 0.001.
Fig. 5
Fig. 5. The ENO2 expression indicates a poor prognosis in HCC patients and is negatively correlated with THRSP level in vivo.
A IHC results showed that ENO2 was upregulated in HCC samples. Scale bars, 50 μm. B Kaplan–Meier analysis showed that high ENO2 levels predicted worse OS and DFS in HCC samples. C THRSP expression was negatively correlated with ENO2 expression in the TCGA database. D IHC results showed that the THRSP expression was inversely correlated with ENO2 expression in HCC samples. Scale bars, 50 μm. E, F Xenograft tumors derived from Huh7-OE and PLC/PRF/5-OE cells were significantly smaller than those derived from the corresponding control cells. G, H qRT-PCR and IHC results confirmed the negative correlation between THRSP and ENO2 expression in Xenograft tumor tissue. I Overexpression of THRSP suppressed the number and size of tumors in the orthotopic HCC model. THRSP was over-expressed in vivo by utilizing adenovirus from intrahepatic injection. *P < 0.05; **P < 0.01; ***P < 0.001.
Fig. 6
Fig. 6. T3 synergistically enhances the antitumor activity of lenvatinib in HCC.
AC CCK-8, colony formation assay, and transwell assay showed the effects of T3 (10 nM) and lenvatinib (10 μM) treatment on HCC cell proliferation, colony formation, migration, and invasion. D Xenograft tumors that received combined therapy with T3 and lenvatinib showed better tumor growth inhibition. E IHC staining showed the levels of THRSP, ENO2, and Ki-67 in mouse xenograft tumors. Scale bars, 50 μm. **P < 0.01; ***P < 0.001.
Fig. 7
Fig. 7
The schematic diagram showing THs inhibit HCC progression and reverse lenvatinib resistance through THRSP-mediated regulation of glycolysis.

References

    1. Faubert, B., Solmonson, A. & DeBerardinis, R. J. Metabolic reprogramming and cancer progression. Science 2020;368:eaaw5473. - PMC - PubMed
    1. Pavlova NN, Thompson CB. The emerging hallmarks of cancer metabolism. Cell Metab. 2016;23:27–47. - PMC - PubMed
    1. Cheng C, Geng F, Cheng X, Guo D. Lipid metabolism reprogramming and its potential targets in cancer. Cancer Commun. 2018;38:27. - PMC - PubMed
    1. Yoshida GJ. Metabolic reprogramming: the emerging concept and associated therapeutic strategies. J Exp Clin Cancer Res. 2015;34:111. - PMC - PubMed
    1. Ganapathy-Kanniappan S, Geschwind JF. Tumor glycolysis as a target for cancer therapy: progress and prospects. Mol Cancer. 2013;12:152. - PMC - PubMed

LinkOut - more resources