. 2025 Mar 7;16(1):2305.
doi: 10.1038/s41467-025-57530-1.

Parvimonas micra promotes oral squamous cell carcinoma metastasis through TmpC-CKAP4 axis

Affiliations

Parvimonas micra promotes oral squamous cell carcinoma metastasis through TmpC-CKAP4 axis

Houbao Qi et al. Nat Commun. .

Erratum in

Abstract

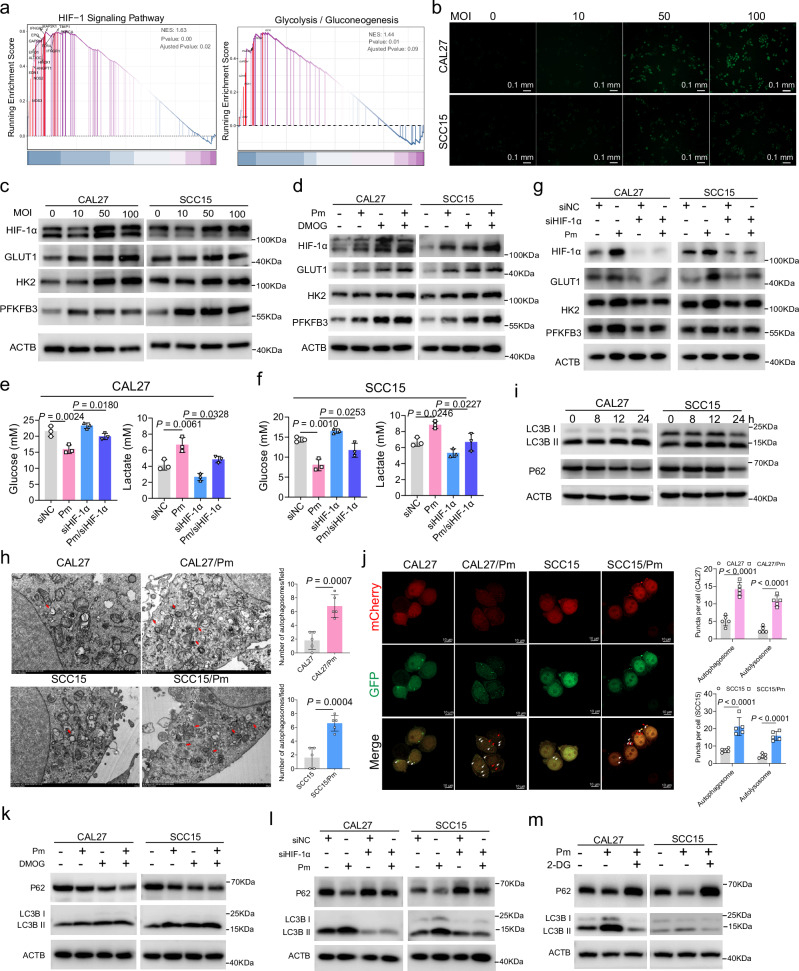
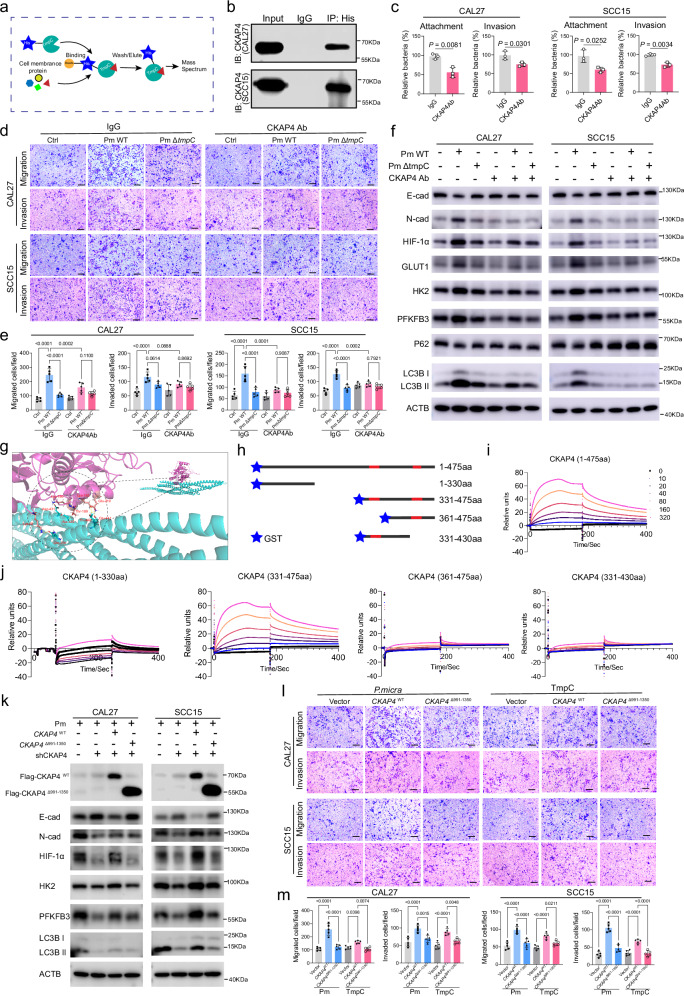
Parvimonas micra (P. micra), an opportunistic oral pathogen associated with multiple cancers, has limited research on its role in oral squamous cell carcinoma (OSCC). This study shows that P. micra is enriched in OSCC tissues and positively correlated with tumor metastasis and stages. P. micra infection promotes OSCC metastasis by inducing hypoxia/HIF-1α, glycolysis, and autophagy. Mechanistically, P. micra surface protein TmpC binds to CKAP4, a receptor overexpressed in OSCC, facilitating bacterial attachment and invasion. This interaction activates HIF-1α and autophagy via CKAP4-RanBP2 and CKAP4-NBR1 pathways, driving metastasis. Targeting CKAP4 with masitinib or antibodies impairs P. micra attachment and abolishes P. micra-promoted OSCC metastasis in vitro and in vivo. Together, our findings identify P. micra as a pathogen that promotes OSCC metastasis and highlight that TmpC-CKAP4 interaction could be a potential therapeutic target for OSCC.


Conflict of interest statement

Competing interests: The authors declare no competing interests.

Figures

Fig. 1
Fig. 1. P. micra enriched in OSCC tissue and correlated with OSCC metastasis.
a The abundance of P. micra in OSCC tissue (n = 37 samples), paracancerous tissue (PC, n = 37 samples) and anatomically matched contralateral normal oral mucosa (NOM, n = 38 independent samples) was plotted in microbiome data. PC vs NOM, P < 0.0001; OSCC vs NOM, P < 0.0001. b Relative abundance of P. micra in OSCC tissues with (n = 13 samples) or without (n = 23 samples) metastasis. P = 0.018. c Relative abundance of P. micra in different stage of OSCC (PC, n = 37 samples; I: T1 N0 M0, n = 2 samples; II: T2 N0 M0, n = 13 samples; III: T1-2 N1 M0 and T3 N0-1 M0, n = 7 samples; IV: T1-3 N2 M0 and T4a N0-2 M0, n = 13 samples. III vs PC, P = 0.0056; IV vs PC, P = 0.0007). d PCoA showing bacterial community variations between paracancerous tissue (PC) and OSCC tissues (GSE227919 dataset). The lower and upper hinges of the box represent the 25th and 75th percentiles, and the whiskers extend to the minimum and maximum values within 1.5 times the interquartile range. The median value is depicted by the line within the box (a-c). e The abundance of P. micra in PC (n = 17 samples) and OSCC tissue (n = 8 samples) of GSE227919 datase. f and g Representative images (f) and quantification analysis (g) of P. micra distribution by FISH staining (Green: P. micra) in normal tongue samples (n = 9 samples), non-metastatic (n = 13 samples) or metastatic (n = 32 samples) OSCC tissues. h and i Representative images (h) and Spearman correlation analysis (i) of P. micra and E-cadherin in OSCC tissue (n = 30 samples). j and k Representative images (j) and Spearman correlation (k) of P. micra and N-cadherin in OSCC tissue (n = 30 samples). Scale bar: 100 μm. Data were presented as the means ± SD. Two-sided Wilcoxon test (ac, e), two-sided unpaired Student’s t test (g) and two-sided spearman test (i, k) were used to examine the statistical significance between groups.
Fig. 2
Fig. 2. P. micra promoted OSCC metastasis in vitro and in vivo.
a Wound-healing migration assay of OSCC cells co-cultured with P. micra in different MOI (n = 3 biological replicates per group). b Trans-well assays of OSCC cell pre-exposed with P. micra for 12 h in different MOI. The indicated migrated and invaded cells were quantified in five randomly selected fields. c Western blot assay of E-cadherin (E-cad) and N-cadherin (N-cad) in OSCC cells infected with P. micra for 24 h. The data are representative of at least two independent experiments with similar results. d qPCR assay of CDH1 and CDH2 (n = 3 biological replicates in each group) in OSCC cells stimulated with P. micra for 24 h. e BALB/c nude mice were implanted with Luc-CAL27 or P. micra stimulated Luc-CAL27 cells on the left lateral edge of the tongue for 3 weeks. f Images of tongue and quantification of tumor volume (n = 7 mice per group). g Images of cervical lymph nodes (cLNs) and quantification of cLNs volume in vivo from 7 mice per group. h and i Representative images of immunofluorescence for CK5/6 (h) and quantification of metastatic area (i) in cLNs in vivo (n = 7 mice per group). Scale bar: 100 μm. j and k Western blot (j) and quantification (k) of E-cadherin and N-cadherin in CAL27 tumors in vivo (n = 3 mice per group). l Schematic diagram of single-cell RNA sequencing analysis of tumor cells from orthotopic CAL27 tumor model. m NNMF and UMAP of tumor cells. n Heatmap showed the differently expressed genes identified by NNMF. The corresponding gene signatures were numbered and selected genes indicated (red). o GSVA showing differences in hallmark pathways in tumor cells between P.micra-exposed tumors and control group. Data were presented as the means ± SD. One-way ANOVA with Turkey’s test (a, b, d, k) and two-sided unpaired Student’s t test (f, g, i) were used to examine the statistical significance between groups. The samples derive from the same experiment but different gels for E-cadherin, another for GAPDH and N-cadherin were processed in parallel (c, k).
Fig. 3
Fig. 3. P. micra activated Hypoxia/HIF-1α, glycolysis and autophagy in OSCC cells.
a The GSEA showing the enrichment of HIF-1 signaling pathway and Glycolysis/Gluconeogenesis pathway in P. micra stimulated group. The p-value is obtained through one-sided permutation test with 1000 permutations. Adjusted p-value is the result of multiple validation correction on the original P-value. b Representative images of the Image-iT Green Hypoxia Reagent analysis. The data are representative of at least two independent experiments with similar results. c Western blot of HIF-1α, GLUT1, HK2 and PFKFB3 by P. micra infection with different MOI for 24 h. d Western blot of HIF-1α, GLUT1, HK2 and PFKFB3 by P. micra infection (MOI = 100) and DMOG (1.0 mM) treatment for 24 h. e and f Glucose and lactate concentration in culture supernatant of CAL27 (e) and SCC15 (f) transfected with siHIF-1α for 24 h and followed by P. micra infection 24 h (n = 3 biological replicates in each group). g Western blot of HIF-1α, GLUT1, HK2 and PFKFB3 in OSCC cells transfected with siHIF-1α for 24 h and followed by P. micra infection 24 h. h TEM showing autophagosomes in CAL27 and SCC15 following P. micra infection for 24 h (n = 5 biological replicates per group). Arrows indicated autophagosome. i Western blot of LC3B and P62 after P. micra infection 24 h. j Representative images and quantification of autophagosome and autolysosome in OSCC cells infected with mRFP-GFP-LC3 adenovirus 24 h and stimulated with P. micra for another 24 h (n = 3 biological replicates per group). White arrows indicated autophagosomes and red arrows indicated autolysosomes. scale bars, 100μm. k Western blot of LC3B and P62 in the presence of DMOG and P. micra for 24 h. l Western blot showing the impact of siHIF-1α on LC3B and P62. m Western blot showing the impact of 2-DG on LC3B and P62. Data were shown as mean ± SD. Blots are representative of at least two biological replicate experiments with similar results (cd, g, i, km). The samples derive from the same experiment but different gels for GLUT1, another for HIF-1α and ACTB, another for HK2 and PFKFB3 were processed in parallel (c, d, g). One-way ANOVA with Turkey’s test (e, f, j) and two-sided unpaired Student’s t test (h) were used to examine the statistical significance between groups.
Fig. 4
Fig. 4. P. micra interacted with OSCC cells via its surface protein TmpC.
a Representative SEM images of CAL27 and SCC15 cells after co-culture with P. micra (MOI = 100). The higher magnification images showed attachment between bacteria and the cells. b Representative TEM images of CAL27 and SCC15 cells after co-culture with P. micra (MOI = 100. Red arrows indicated intracellular P. micra and white arrows indicated cell-surface P. micra. c Wound-healing migration assays of OSCC cell stimulated with TmpC (0.05 and 0.1 mg/mL) for 24 h (n = 3 biological replicates per group). Scale bar: 100 μm. d Trans-well assays of OSCC cells pre-stimulated with TmpC (0.05 and 0.1 mg/mL) for 24 h (n = 5 biological replicates per group). Scale bar: 100 μm. e Representative images of the Image-iT Green Hypoxia Reagent assay of OSCC cell stimulated with TmpC for 24 h. f The schematic representation of the insertional inactivation of TmpC in P. micra. DNA fragment containing ermB gene was constructed and transformed into P. micra wild type (PmWT) for homologous recombination. g PCR of insertion mutants of PmWT. Bacteria chromosomal DNA was used as template for the PCR and different primers indicated in (f) were used to validate ermB insertion. h PmΔtmpC showed decreased adhesion and invasion ability compared with PmWT (n = 3 biological replicates per group). i BALB/c nude mice were implanted with PmWT or PmΔtmpC treated CAL27 cells on the left lateral edge of the tongue for 3 weeks. j and k Images of tongue (j) and quantification of tumor volume (k, n = 8 mice per group). l and m Representative images of cLNs (l) and quantification of volume quantification of cLNs volume (m) from 8 mice per group. n and o Representative images of immunofluorescence for CK5/6 (n) and quantification of metastatic area (o, n = 8 mice per group) in cLNs. Scale bar: 500 μm for 2X and 100 μm for 10X. Images are representative of two independent experiments (a, b, e, g). Data were shown as mean ± SD. One-way ANOVA with Turkey’s test (c, d, k, m, o) and two-sided unpaired Student’s t test (h) were used to examine the statistical significance between groups.
Fig. 5
Fig. 5. P. micra surface TmpC bound to CKAP4 on OSCC cells.
a OSCC cell membrane protein was incubated with His-TmpC together with His magnetic beads for His-pull-down assay and mass spectrometry analysis. b Immunoprecipitation showing His-TmpC directly bound to CKAP4 in OSCC cells. c CKAP4Ab suppressed the attachment and invasion of P. micra in OSCC cells (n = 3 biological replicates in each group). d and e Representative images (d) and quantitation (e) of cell migration and invasion of OSCC cells preincubated with CKAP4Ab and treated by PmWT and Pm∆tmpC. The indicated migrated and invaded cells were quantified in five randomly selected fields. Scale bars: 100 μm. f Western blot of E-cadherin (E-cad), N-cadherin (N-cad), HIF-1α, GLUT1, HK2, PFKFB3, P62 and LC3B in OSCC cells preincubated with CKAP4Ab and treated by PmWT and Pm∆tmpC. The samples derive from the same experiment but different gels for N-cadherin and GLUT1, another for HIF-1α and ACTB, another for HK2 and PFKFB3, another for E-cadherin, P62 and LC3B were processed in parallel. g Plausible binding mode of CKAP4 (green) with TmpC (pink) from molecular docking study. h Schematic illustration of the full-length CKAP4 protein and the truncated forms of CKAP4 tagged with GST. Red segments indicated predicted binding sites. i and j SPR binding sensorgrams and affinity fit curves for the interaction of TmpC with CKAP4 in vitro. k Western blot of proteins expression in shCKAP4 OSCC cells transfected with full-length CKAP4 (CKAP4WT) or CKAP4 mutant lacking the TmpC-binding site (CKAP4Δ991-1350) and stimulated by P. micra. The samples derive from the same experiment but different gels for N-cadherin and GLUT1, another for HIF-1α and ACTB, another for HK2 and PFKFB3, another for E-cadherin, P62 and LC3B, another for Flag were processed in parallel. l and m Representative images (l) and quantitation (m) of cell migration and invasion of OSCC cells transfected with CKAP4WT and CKAP4Δ991-1350 and stimulated by P. micra (n = 5 biological replicates in each group). Scale bars: 100 μm. Data were shown as mean ± SD. Blots are representative of at least two biological replicate experiments with similar results (f, k). One-way ANOVA with Turkey’s test (e, m) and two-sided unpaired Student’s t test (c) was used to examine the statistical significance between groups.
Fig. 6
Fig. 6. TmpC-CKAP4 stabilized HIF-1α by binding RanBP2 and induced autophagy by binding NBR1.
a Immunoprecipitation of CKAP4 followed by HPLC-MS identified CKAP4-bound proteins. b Co-IP and immunoblotting detection showed the interaction between RanBP2 and CKAP4. c Co-IP and immunoblotting detection showed the interaction between HIF-1α and SUMO1. d TAK981 decreased the expression of HIF-1α and HK2. The samples derive from the same experiment but different gels for HIF-1α and ACTB, another for HK2 were processed in parallel. e siRanBP2 decreased the expression of HIF-1α. f Co-IP and immunoblotting detection showed the interaction between NBR1 and CKAP4. g Co-IP and immunoblotting detection showed the binding of P62 with CKAP4 and NBR1. h siNBR1 increased P62 and decreased LC3B II. i siNBR1 decreased the P62 bodies (n = 5 cells per group). The samples derive from the same experiment but different gels for NBR1 and ACTB, another for P62 and LC3B were processed in parallel. jl Representative immunofluorescence images (j) and quantification (k, l, n = 15 cells per group) showing siCKAP4 inhibited the co-localization of NBR1 with P62 bodies. The ratio quantified by comparing the number of NBR1-positive P62 bodies to all P62 bodies per cell. Scale bar: 10 μm. m A schematic diagram illustrating the mechanisms of P. micra TmpC promoted OSCC metastasis, created in figdraw.com. Data were shown as mean ± SD. Blots are representative of at least two biological replicate experiments with similar results (bh). One-way ANOVA with Turkey’s test was used to examine the statistical significance between groups.
Fig. 7
Fig. 7. Blockade of CKAP4 attenuated P. micra/TmpC-promoted OSCC metastasis.
a Plausible binding mode of CKAP4 with imidurea, masitinib, fostamatinib, and quizartinib. b and c The impact of imidurea, masitinib, fostamatinib, and quizartinib on P. micra attachment (b) and invasion (c) to the OSCC cells (n = 3 biological replicates per group). d Wound-healing migration assays showed the impact of masitinib on P. micra-promoted OSCC motility. The average rate quantified in five randomly selected fields. Scale bar: 100 μm. e Schematic diagram showing OSCC orthotopic xenograft therapy model. f and g Quantification of tumor volume (f) and cLNs volume (g) from 7 mice per group. h Representative luciferase images of tongue and cLNs. i and (j) Quantification of bioluminescence in tumor (i) and cLNs (j) from 5 mice per group. k Representative immunofluorescence images of CK5/6 in cLNs. Scale bar: 100 μm. l Quantification of metastatic area in cLNs (n = 7 mice per group). m Western blot of E-cadherin, N-cadherin, HIF-1α, HK2, PFKFB3 and P62 in OSCC orthotopic xenograft model (mixed 3 mice per group, blots are representative of at least two biological replicate experiments with similar results. The samples derive from the same experiment but different gels for N-cadherin and GLUT1, another for HK2 and ACTB, another for HIF-1α and PFKFB3, another for E-cadherin and P62 were processed in parallel). n and o Representative images (n) and Spearman correlation (o) of P. micra abundance and CKAP4 expression in OSCC tissue. Scale bar: 100 μm. p The expression of CKAP4 in TCGA-HNSCC (Normal, n = 30 independent samples; OSCC, n = 262 independent samples) and GEO GSE42743 dataset (Normal, n = 29 independent samples; OSCC, n = 74 independent samples). The lower and upper hinges of the box represent the 25th and 75th percentiles, and the whiskers extend to the minimum and maximum values within 1.5 times the interquartile range. The median value is depicted by the line within the box. q Kaplan-Meier survival analysis and the log-rank test of overall survival rate in GEO GSE42743 and GSE41613 dataset. Data were shown as mean ± SD. One-way ANOVA with Turkey’s test (b, c, d, f, g, i, j, l), two-sided spearman test (o) and two-sided Wilcox test (p) were used to examine the statistical significance between groups.

References

    1. Vadovics, M. et al. Candida albicans enhances the progression of oral squamous cell carcinoma in vitro and in vivo. mBio13, e0314421 (2021). - PMC - PubMed
    1. Tang, Q. et al. Circadian clock gene Bmal1 inhibits tumorigenesis and increases paclitaxel sensitivity in tongue squamous cell carcinoma. Cancer Res.77, 532–544 (2017). - PubMed
    1. Chinn, S. B. & Myers, J. N. Oral cavity carcinoma: current management, controversies, and future directions. J. Clin. Oncol.: Off. J. Am. Soc. Clin. Oncol.33, 3269–3276 (2015). - PMC - PubMed
    1. J, S. H. & Hysi, D. Methods and risk of bias in molecular marker prognosis studies in oral squamous cell carcinoma. Oral. Dis.24, 115–119 (2018). - PubMed
    1. Buchta Rosean, C. et al. Preexisting commensal dysbiosis is a host-intrinsic regulator of tissue inflammation and tumor cell dissemination in hormone receptor-positive breast cancer. Cancer Res.79, 3662–3675 (2019). - PMC - PubMed

Substances