. 2025 Mar 7;16(1):2283.
doi: 10.1038/s41467-025-57632-w.

Senescent-like microglia limit remyelination through the senescence associated secretory phenotype

Affiliations

Senescent-like microglia limit remyelination through the senescence associated secretory phenotype

Phillip S Gross et al. Nat Commun. .

Abstract

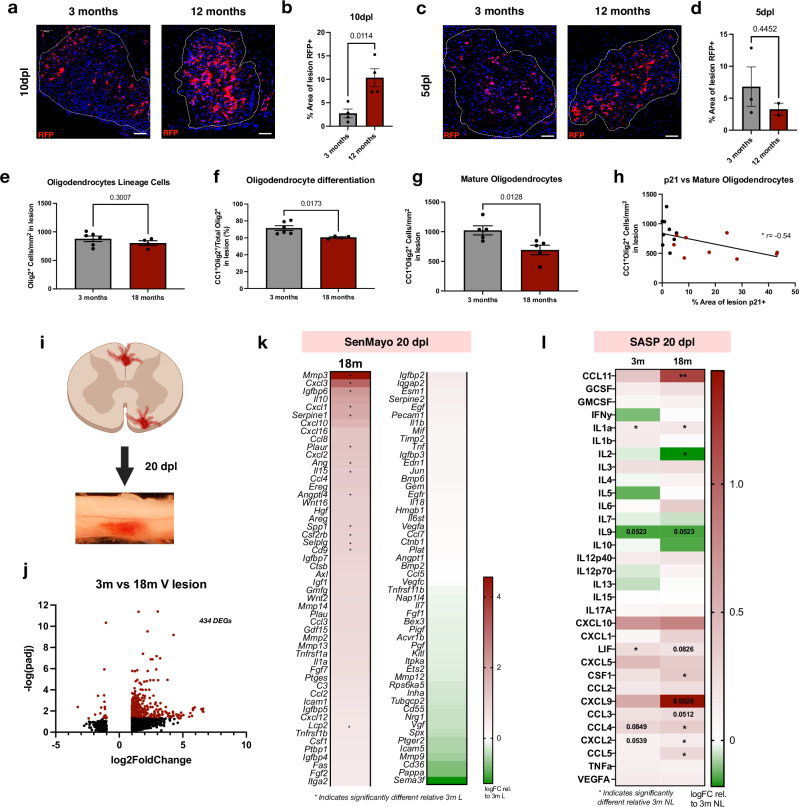
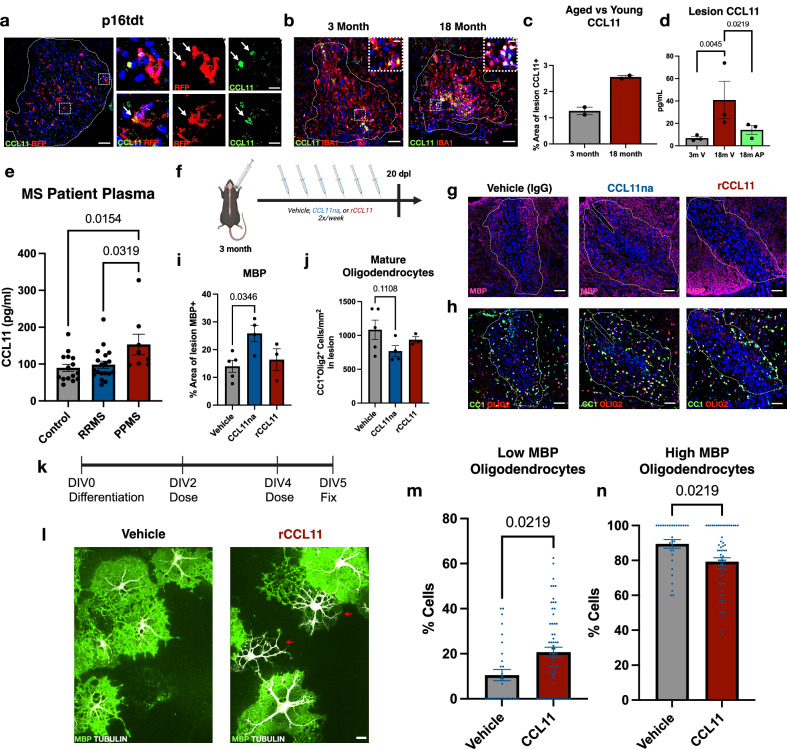
The capacity to regenerate myelin in the central nervous system diminishes with age. This decline is particularly evident in multiple sclerosis (MS), a chronic demyelinating disease. Whether cellular senescence, a hallmark of aging, contributes to remyelination impairment remains unknown. Here, we show that senescent cells accumulate within demyelinated lesions after injury, and treatments with senolytics enhances remyelination in young and middle-aged mice but not aged mice. In young mice, we observe the upregulation of senescence-associated transcripts, primarily in microglia and macrophages, after demyelination, followed by a reduction during remyelination. However, in aged mice, senescence-associated factors persist within lesions, correlating with inefficient remyelination. Proteomic analysis of the senescence-associated secretory phenotype (SASP) reveals elevated levels of CCL11/Eotaxin-1 in lesions of aged mice, which is found to inhibit oligodendrocyte maturation. These results suggest therapeutic targeting of SASP components, such as CCL11, may improve remyelination in aging and MS.


Conflict of interest statement

Competing interests: The authors declare no competing interests.

Figures

Fig. 1
Fig. 1. Senescent microglia/macrophages following demyelination.
a Schematic of lysophosphatidylcholine (LPC) induced demyelination. b Lesions identified in all experiments by hyper-nucleated regions of white matter which inversely reflect myelination (MBP). c Typical progression of remyelination at specified time points following LPC-induced lesions. d Schematic of p16-tdTomato mouse model. e Immunofluorescent staining of p16tdt+ cells throughout remyelination in 3 months old mice (dpl: days post lesion). f Quantification of (e) (n = 13 NL, 3 5dpl, 4 10dpl, 2 20dpl, 2 60dpl; each n denotes biologically independent replicate). g Violin plots depicting the SenMayo geneset score in the naive mouse spinal cord (n = 2) and at 5 (n = 3), 10 (n = 2), and 20 (n = 3) dpl from reanalyzed snRNA-sequencing data (n denotes biologically independent replicate; 7872 nuclei per timepoint). Boxplots show distribution of geneset score at the single nucleus level and statistical information is in source Data file. h Line graph indicating the normalized mean expression of Cdkn2a/P16 across all cells in naïve samples, and at 5, 10, and 20dpl in (g). Line graphs are 95% confidence interval. i In Vivo Imaging System (IVIS) bioluminescence of controls and p16tdt lesions (n = 1 WT, 1 Sham L, 2 p16tdt L). jm Immunofluorescent (IHC) staining and Imaris 3D reconstruction of p16tdt and CD11b, GFAP, CC1, and NKX2.2 colocalization. n Quantification of (jm) (n = 7 CD11b, 8 CC1, 6 NKX2.2; each n denotes biologically independent replicate). o, p Percentages of p16tdt+ cells CD11b+ and CD11b+ cells p16tdt + . q Uniform manifold approximation and projection (UMAP) visualization of re-analyzed microglia from snRNA-sequencing of chronic active lesions, inactive lesions, and control samples (1815 total microglia). r UMAP showing the weighted gene density estimation of the senescence score, aggregate sum expression of genes found in Supplementary data 1. s Violin plots describing expression levels of P16/Cdkn2a in microglia in chronic active lesions, inactive lesions, and control samples (n = 1321, 349, 145 microglia, respectively). Data are mean ± SEM (f, n) or median (g). Scale bar, 50 µm (b, e), 5 µm (k, l) 1 µm (j, m). P values derived from one-way ANOVA with Tukey corrected multiple comparisons (f, n), or the two-tailed Wilcoxon test followed by Bonferroni correction (g). Select figures created in BioRender (2025) (a, d) https://BioRender.com/r92t091, (c) https://BioRender.com/b11w175. Source data are provided as a Source Data file.
Fig. 2
Fig. 2. Increased senescent markers and SASP proteins characterize aged lesion after demyelination.
a Schematic of MERFISH spatial transcriptomics. b Demyelinated lesions were traced in young (3 months) and aged (18-22 months) mice at 5 dpl. c UMAP visualization of lesion cell types in young and aged lesions (n = 2 per group). Uniform manifold approximation and projection (UMAP) visualization of young and aged lesions by cell types. d Comparison of senescent cells in pooled lesions vs naïve non-lesion controls regardless of age (n = 4 per group; each n denotes biologically independent replicate lesion or non-lesion from the same mouse). e Heatmap depicting top differentially expressed genes between young and aged lesions at 5 dpl. Color represents LogFC relative to young lesion and * indicates significantly differentially expressed. f Dot plot describing senescent gene expression across pooled lesion and non-lesion (n = 4 per group). g Dot plot describing senescent gene expression across young and aged lesions (n = 2 per group). h Heatmap depicting percentage of cell types observed to be senescent in young and aged lesion and non-lesion. Color represents % of cells senescent. i Comparison of percentage of senescent microglia and macrophages in pooled lesion and non-lesion regardless of age (n = 4 per group; each n denotes biologically independent replicate lesion or non-lesion from the same mouse). j Heatmap depicting SASP (senescence associated secretory phenotype) protein levels in young and aged lesions relative to young non-lesioned white matter at 5 dpl (n = 3 per group). Color represents LogFC relative to young non-lesion and * indicates significantly differentially expressed. Data are mean ± SEM (d, i). P-values derived from two-sided student’s t-test (d, i), two-way ANOVA with FDR corrected multiple comparisons (j) or the two-sided Wald test (e). Select figures created in BioRender (2025) (a) https://BioRender.com/j71l219. Source data are provided as a Source Data file.
Fig. 3
Fig. 3. Persistence of senescent cells in lesions are associated with impaired oligodendrocyte differentiation in aged mice.
a Immunofluorescent staining of p16tdt in young (3 months) and middle-aged (12 months) lesions at 10 dpl (days post lesion). b Quantification of p16tdt+ cells in a (n = 4 per age). c Immunofluorescent staining of p16tdt in young and middle-aged lesions at 5 dpl. d Quantification of p16tdt+ cells in (c) (n = 3 3 m, 2 18 m). e Quantification of OLIG2 in young and aged (18–22 months) lesions (n = 6 3 m, 4 18 m). f Quantification of percentage of differentiated oligodendrocytes in young and aged lesions (n = 6 3 m, 4 18 m). g Quantification of mature oligodendrocytes with CC1 and OLIG2 in young and aged lesions (n = 5 per age). h Correlation between P21+ staining and mature oligodendrocytes (CC1 + OLIG2 + ) in the lesions. i Experimental schematic of lesion microdissection and neutral red for bulk RNA-sequencing. j Volcano plot of significantly differentially expressed genes between young lesions and aged lesions at 20 dpl (n = 3 per group). Genes with adjusted p-values < 0.05 and absolute log2 fold changes >1 were called as differentially expressed genes for each comparison. k Heatmap depicting SenMayo gene expression in aged lesions relative to young lesions (n = 3 per group). Color represents LogFC relative to young lesion and * indicates significantly differentially expressed. l Heatmap depicting SASP (senescence associated secretory phenotype) protein levels in young and aged lesions relative to young naïve non-lesioned white matter (n = 3 per group). Color represents LogFC relative to young naïve non-lesion and * indicates significantly differentially expressed. Data are mean ± SEM (b, dg). Scale bar, 50 µm (a, c). P values derived from two-tailed unpaired Student’s t-tests (b, dg), simple-linear regression (h), two-way ANOVA with FDR corrected multiple comparisons (l) or the two-sided Wald test (j, k). Select figures created in BioRender (2025) (i) https://BioRender.com/r92t091Source data are provided as a Source Data file.
Fig. 4
Fig. 4. Treatment with senolytics increases remyelination in young but not aged mice.
a Schematic of INK-ATTAC mouse model. b, c Experimental schematics of vehicle, AP20187 (2 mg/kg) and Dasatinib (5 mg/kg)/ Quercetin (50 mg/kg) (D/Q) treatments. d, i, m, q Immunofluorescent staining of mature oligodendrocytes and oligodendrocyte lineage cells with CC1 and OLIG2 in (d) young (3 months) vehicle and AP treated lesions at 20 dpl (days post lesion), i middle-aged (12 months) vehicle and AP treated lesions at 20 dpl, (m) aged (18–22 months) vehicle and AP treated lesions at 30 dpl, and (q) middle-aged (12 months) vehicle and D/Q treated lesions at 20 dpl. e, f Quantification of OLIG2+ and CC1 + OLIG2+ cells in (d) (n = 5 V, 6 AP). g Scanning electron microscopy images of remyelinated axons in young vehicle and AP treated lesions at 20 dpl (n = 3 mice per group). h Violin plot of g-ratio’s of remyelinated axons counted from g (n = 300–400 axons per group). jl Quantification of OLIG2+ and CC1 + OLIG2+ cells and MBP+ area in i and extended fig. 7a (n = 4 per group (jk); n = 5 per group i). np Quantification of OLIG2+ and CC1 + OLIG2+ cells and MBP+ area in m and extended fig. 7b (n = 5 V no, 4 V p, n = 9 AP np). rt Quantification of OLIG2+ and CC1 + OLIG2+ cells and MBP+ area in (q) and extended fig. 7c (n = 6 V, 5 D/Q). u Heatmap depicting SASP (senescence associated secretory phenotype) protein levels in young naïve non-lesion, aged non-lesion, young vehicle treated, aged vehicle treated, and aged AP treated lesions relative to young naïve non-lesioned white matter (n = 3 per group). Color represents LogFC relative to young non-lesion and * indicates significantly differentially expressed from 3 m non-lesion, # indicates significantly differentially expressed between 18 mL and 18 m AP L. v Venn-diagram of elevated SASP factors in the aged demyelinated lesions, SASP factors changed with AP treatment, and proteins known to restrict OPC differentiation. Data are mean ± SEM (e, f, h, jl, np, rt). Scale bar, 50 µm (d, i, m, q), 2 µm (g). P-values derived from two-tailed unpaired Student’s t-tests (e, f, h, jl, np, rt), or two-way ANOVA with FDR corrected multiple comparisons (u). Select figures created in BioRender (2025) (a) https://BioRender.com/p01d544, b, c https://BioRender.com/x25z952. Source data are provided as a Source Data file.
Fig. 5
Fig. 5. CCL11 is a SASP factor driving remyelination impairment.
a Immunofluorescent staining of p16tdt+ cells (RFP) and CCL11 in 12 months old demyelinated lesions. Arrows indicate p16tdt + CCL11+ colocalization (n = 4 mice). b Immunofluorescent staining of microglia (IBA1) and CCL11 in young (3 months) and aged (18–22 months) demyelinated lesions. c Quantification of CCL11 in b (n = 2 per group). d Protein levels of CCL11 in young, aged vehicle treated, and aged AP treated lesions at 20 dpl (n = 3 per group; each n denotes biologically independent replicate). e CCL11 plasma concentrations in healthy control, Relapse Remitting MS, and Primary Progressive MS samples (n = 15 C, 19 RRMS, 8 PPMS, uncorrected for age; each n denotes biologically independent replicate). f Experimental schematic of IgG vehicle (50 µg/kg), CCL11 neutralizing antibody (CCL11na) (50 µg/kg), or recombinant CCL11 (rCCL11) (10 µg/kg) treatment of young lesions. g, h Immunofluorescent staining of mature oligodendrocytes with CC1 and OLIG2 and myelin with MBP in vehicle, CCL11na, and rCCL11 treated lesions at 20 dpl. i, j Quantification of MBP+ area and CC1 + OLIG2+ cells in (g, h) (n = 5 V, 4 CCL11na, 3 rCCL11; each n denotes biologically independent replicate). k Schematic of in vitro experiment timeline. l Immunofluorescent staining of primary rat oligodendrocytes treated with vehicle or recombinant CCL11 (100 ng/µL dosed at DIV2, DIV4) for MBP and alpha/beta tubulin. Red arrows denote low MBP cells. m Quantification of DIV5 oligodendrocytes demonstrate higher percentage of CCL11-treated cells have low MBP expression (20.7 ± 2.2%) compared to control cells (10.5 ± 2.5%) n, Quantification of DIV5 oligodendrocytes demonstrate lower percentage of CCL11-treated cells have high MBP expression (79.3 ± 2.2%) compared to control cells (89.5 ± 2.5%) (for m, n: n = 30 FOVs for control group and n = 63 FOVs for rCCL11-treated group across cultures from 2 biological replicates, 3 experiments, 1–2 coverslips per condition per experiment. Data points refer to fields of view). Images represent half field of view. Data are mean ± SEM (ce, i, j, m, n). Scale bar, 50 µm (a, b, g, h), 20 µm (i), 10 µm (a, b insets). P-values derived from two-sided Kolmogorov-Smirnov t-test (m, n), one-way ANOVA with Tukey corrected multiple comparisons (d, i, j), or one-way ANOVA with FDR corrected multiple comparisons (e). Select figures created in BioRender (2025) (f) https://BioRender.com/x25z952. Source data are provided as a Source Data file.

Update of

References

    1. Reich, D. S., Lucchinetti, C. F. & Calabresi, P. A. Multiple Sclerosis. N. Engl. J. Med.378, 169–180 (2018). - PMC - PubMed
    1. Franklin, R. J. M. & Ffrench-Constant, C. Remyelination in the CNS: From biology to therapy. Nat. Rev. Neurosci.9, 839–855 (2008). - PubMed
    1. Franklin, R. J. M., Zhao, C. & Sim, F. J. Ageing and CNS remyelination. Neuro. Rep.13, 923–928 (2002). - PubMed
    1. Neumann, B., Segel, M., Chalut, K. J. & Franklin, R. J. Remyelination and ageing: Reversing the ravages of time. Mult. Scler. J.25, 1835–1841 (2019). - PMC - PubMed
    1. Graves, J. S., et al. Ageing and multiple sclerosis. Lancet Neurol. S1474442222001843 10.1016/S1474-4422(22)00184-3 (2022).

MeSH terms

LinkOut - more resources