. 2025 Mar 7;16(1):2307.
doi: 10.1038/s41467-025-57625-9.

Spatiotemporally resolved transcriptomics reveals the cellular dynamics of human retinal development

Affiliations

Spatiotemporally resolved transcriptomics reveals the cellular dynamics of human retinal development

Jinglong Zhang et al. Nat Commun. .

Abstract

The morphogenesis and cellular interactions in developing retina are incompletely characterized. The full understanding needs a precise mapping of the gene expression with a single-cell spatial resolution. Here, we present a spatial transcriptomic (ST) resource for the developing human retina at six developmental stages. Combining the spatial and single-cell transcriptomic data enables characterization of the cell-type-specific expression profiles at distinct anatomical regions at each developmental stage, highlighting the spatiotemporal dynamics of cellular composition during retinal development. All the ST spots are catalogued into consensus spatial domains, which are further associated to their specific expression signatures and biological functions associated with neuron and eye development. We prioritize a set of critical regulatory genes for the transitions of spatial domains during retinal development. Differentially expressed genes from different spatial domains are associated with distinct retinal diseases, indicating the biological relevance and clinical significance of the spatially defined gene expression. Finally, we reconstruct the spatial cellular communication networks, and highlight critical ligand-receptor interactions during retinal development. Overall, our study reports the spatiotemporal dynamics of gene expression and cellular profiles during retinal development, and provides a rich resource for the future studies on retinogenesis.


Conflict of interest statement

Competing interests: The authors declare no competing interests.

Figures

Fig. 1
Fig. 1. Overview of the study.
a The human embryonic retinal samples used in this study. b Schematic showing the data preprocessing framework. The 10x Genomics Visium spatial transcriptomes (i.e., gene expression profiles at spot level) and the corresponding anatomical regions of ST spots annotated based on H&E staining are integrated for downstream analysis. c Spatial visualization of the marker genes of NBL (SOX2 and SOX9) and GCL (TUBB3 and SNCG) at PCW9, PCW14 and PCW17. One section was obtained from each retinal sample. Scale bar, 200 μm. d UMAP plot of gene expression profiles using ST spots from all Visium slices. The spots are colored by radial sublayer annotations, as well as shown with varying sizes by tangential annotations.
Fig. 2
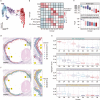
Fig. 2. Spatiotemporal dynamics of cellular composition during retinal development.
a Gene expression correlation between the Visium ST data from our study and the single-cell reference data from Lu et al.. b Spatial distributions of various differentiated cell types during development. c Relative cell count of each retinal cell type during development. Left: differentiated cell types, including AC (amacrine cell), BC (bipolar cell), Cone, HC (horizontal cell), RGC (retinal ganglion cell) and Rod. Right: precursor cell types, including AC-HC Precur (amacrine-horizontal precursor), BC-Photo Precur (bipolar-photoreceptor precursor), neurogenic cell and RPC (retinal progenitor cell).
Fig. 3
Fig. 3. Consensus spatial domain detection of ST spots reveals spatiotemporal changes during retinal development.
a UMAP plot of gene expression profiles using ST spots from all Visium slices. The spots are colored by spatial domain annotations (D1–D9). b Heatmap illustrating the enriched cell types associated with each spatial domain. AC amacrine cell, BC bipolar cell, HC horizontal cell, RGC retinal ganglion cell, RPC retinal progenitor cell, AC-HC Precur, amacrine-horizontal precursor, BC-Photo Precur bipolar-photoreceptor precursor. c Spatial distributions of each spatial domain, related to the radial sublayer (top) and absolute tangential angle (bottom). n = 1541 spots were examined. For box plots, boxes represent the interquartile range (25th to 75th percentiles), center lines indicate medians, and whiskers extend to the minima and maxima. d Visualization on the spatial distributions of spatial domains at PCW17. Scale bar, 200 μm. e The four gene modules (M1–M4) identified by WGCNA. For each gene module, the most enriched biological function, and the enrichment in each spatial domain are shown. n = 1541 spots were examined. For box plots, boxes represent the interquartile range (25–75th percentiles), center lines indicate medians, and whiskers extend to the minima and maxima. f Visualization on the spatial distributions of gene modules at PCW17. Scale bar, 200 μm.
Fig. 4
Fig. 4. Putative critical regulatory genes for each spatial domain during retinal development.
a Up-regulated TFs and RBPs for each spatial domain between neighboring developmental stages. b Examples illustrating the expression dynamics of putative critical regulatory genes in each spatial domain during development. c Expression dynamics of growth factors that are related to retinal development in each spatial domain during development.
Fig. 5
Fig. 5. Spatiotemporal specificity of genes associated with retinal diseases.
a Clustering of retinal diseases based on the average expression levels of the disease-associated genes across different spatial domains. BBS Bardet-Biedl syndrome, CD chorioretinal atrophy or degeneration, COD/CORD cone or cone-rod dystrophy, CSNB congenital stationary night blindness, DA/DS deafness alone or syndromic, LCA Leber congenital amaurosis, MD macular degeneration, ODD ocular-retinal developmental disease, OA optic atrophy, RP retinitis pigmentosa, SDWR syndromic/systemic diseases with retinopathy, USH Usher syndrome, AMD age-related macular degeneration, ROP retinopathy of prematurity. b Overlap between the disease-associated genes, the putative regulatory genes for spatial domains, and the DEGs of spatial domains. Two-sided Fisher’s exact test. c Comparison of expression levels of genes involved with fatty acid and fat-soluble vitamin metabolism in retinal (n = 1541 spots) versus non-retinal (n = 14,700 spots) regions. ****P < 10−4; ns not significant, one-sided Wilcoxon rank-sum test. FAM fatty acid metabolism, FSVB fat-soluble vitamin biosynthetic, FSVC fat-soluble vitamin catabolic, VAM vitamin A metabolic, VDM vitamin D metabolic, VEM vitamin E metabolic, VKM vitamin K metabolic. For box plots, boxes represent the interquartile range (25th to 75th percentiles), center lines indicate medians, and whiskers extend to the minima and maxima. d Expression dynamics of the genes related to fatty acid and fat-soluble vitamin metabolism during development. e Visualization of spatial distribution for the genes associated with vitamin A metabolism across 6 retinal samples. Scale bar, 1 mm.
Fig. 6
Fig. 6. Inference of spatial cellular communications during retinal development.
a Spatial signaling directions in each developmental stage. b SCSs for each L-R interaction across all samples. The L-R interactions are colored by interaction types including cell-cell contact and secreted signaling. c Visualization of spatial distribution for the ligand gene MDK and the receptor gene LRP1. d The immunohistochemistry experiments showing the co-occurrence of the ligand gene MDK and the receptor gene LRP1 during development. The retinal sections were obtained from three samples at PCW12, PCW14 and PCW16. Scale bar, 100μm.

References

    1. Cvekl, A. & Zhang, X. Signaling and Gene Regulatory Networks in Mammalian Lens Development. Trends Genet33, 677–702 (2017). - PMC - PubMed
    1. Gregory-Evans, C. Y., Wallace, V. A. & Gregory-Evans, K. Gene networks: dissecting pathways in retinal development and disease. Prog. Retin Eye Res.33, 40–66 (2013). - PubMed
    1. Fuhrmann, S. Eye morphogenesis and patterning of the optic vesicle. Curr. Top. Dev. Biol.93, 61–84 (2010). - PMC - PubMed
    1. Hoshino, A. et al. Molecular Anatomy of the Developing Human Retina. Dev. Cell43, 763–779.e764 (2017). - PMC - PubMed
    1. Reese, B. E. Development of the retina and optic pathway. Vis. Res.51, 613–632 (2011). - PMC - PubMed

LinkOut - more resources